

Open-ended questions are where respondents tell you why. But they're also where survey analysis tends to stall.
One of our customers used to spend almost a week coding just three open-ended questions with 500 respondents each. However, why that eats so much time doesn't come down to just one thing:
- Thousands of responses that someone has to read, code, and count
- Mixed-language responses that need translating before anyone can code them
- Trackers that need the same codes applied consistently from wave to wave
- Clients who want every theme broken out by age, gender, region, or customer type
AI makes the coding part fast. But coding is only one step in open-ended survey analysis, and most of the accuracy is decided in the steps around it: how the data is prepared, how each question is configured, and how the results are reviewed and compared across segments.
Below, we'll walk through the full workflow step by step, using BTInsights as the example.
What Open-Ended Survey Analysis Covers
Open-ended survey analysis is broader than coding.
Verbatim coding turns free-text responses into a set of codes and counts. Analysis, on the other hand, goes further. It checks whether the responses are worth analyzing in the first place, quantifies themes, compares them across segments, and explores questions the code frame alone can't answer.
Here's how the full workflow breaks down:
| Step | What happens | What you get |
|---|---|---|
| 1. Upload | Bring in the full survey dataset with respondent IDs | Open-ended questions identified and ready to code |
| 2. Clean and prepare | Flag low-quality responses, remove PII, translate, and build merged or segment columns | A dataset that's reliable to code |
| 3. Code | Generate a code frame or apply your own, configured for each question | Codes, frequencies, and percentages |
| 4. Review | Reassign responses and merge, split, or net codes | A final code frame your team stands behind |
| 5. Export | Download the coded data in your preferred format | Excel or SPSS files linked to respondent IDs |
| 6. Cross-tab and sig test | Break codes out by segment and run significance testing | Tables showing where themes differ |
| 7. Explore | Ask open questions of the full dataset | Insights backed by supporting tables |
Keep in mind that not every project needs all seven steps. A quick pulse survey might stop at the export. A tracker reported to a client by segment will likely use every one.
Step 1: Upload the Full Survey Dataset
It's tempting to upload only the open-ended column you want coded.
Upload the whole dataset instead, or at least include the respondent ID column alongside the open-ends. When you export the coding results later, the respondent ID lets you match every code back to the person who gave the response (and from there, to everything else you know about them).
Step 2: Clean and Prepare the Data
This is the step teams skip most often. It's also where a lot of coding problems start.
Any problem left in the data at this stage gets coded, counted, and reported right along with everything else.
Flag low-quality and AI-generated responses
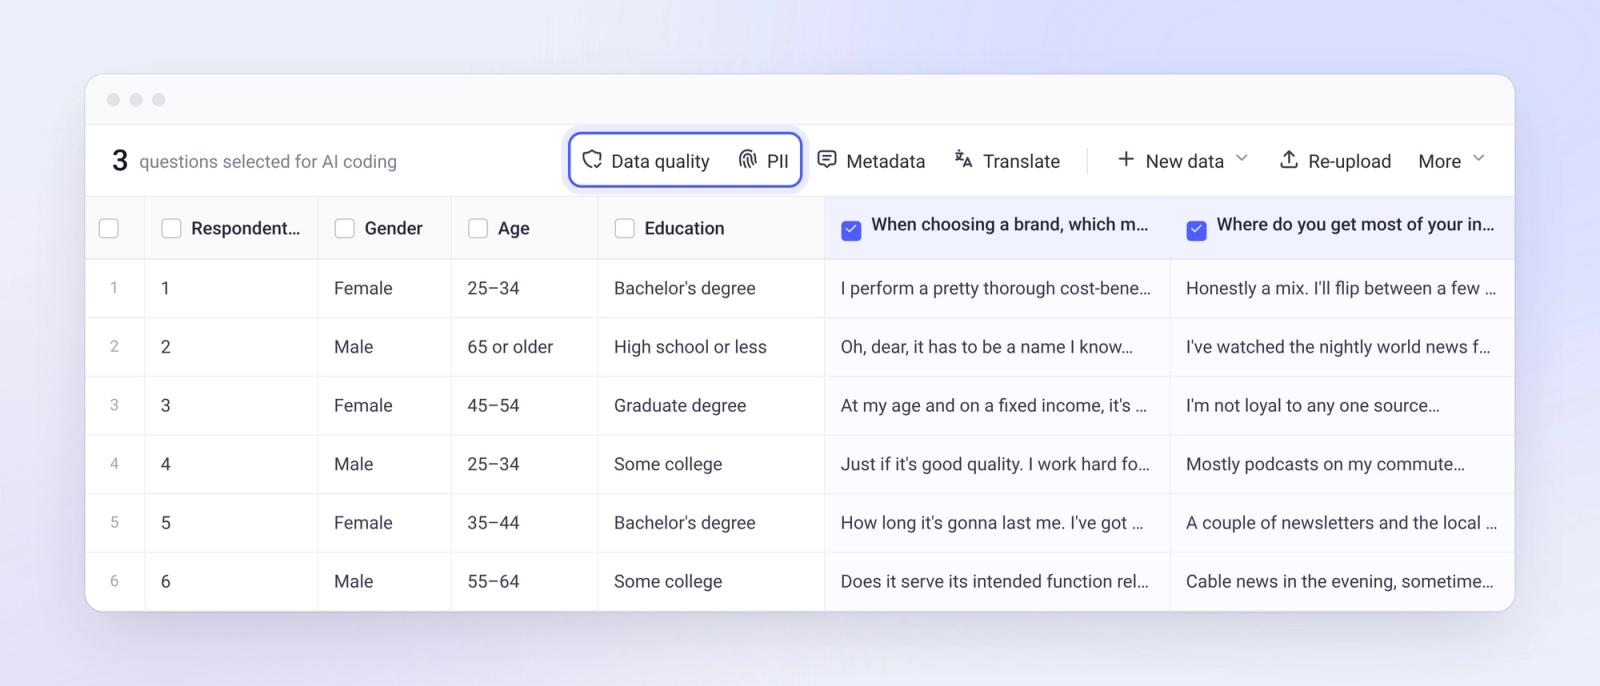
Survey data increasingly includes responses that didn't come from a real, engaged respondent. Some are bots or AI-generated text. Others are duplicates, contradictory answers, or straightlining.
BTInsights runs a data quality check across the dataset that flags AI-like responses, contradictions, duplicates, and straightlining, and shows the evidence behind each flag. The researcher makes the final call on whether to keep or exclude each response.
Detect and remove personal information
Open-ended answers sometimes include names, email addresses, phone numbers, or other details respondents shouldn't have shared. Use PII detection to find and remove that information before sharing the raw data with any external parties.
Translate mixed-language responses
Multi-market surveys often return several languages within the same question. Instead of sending responses out for translation, you can translate them inside the platform. Coding also works across 50+ languages, including datasets where several languages appear side by side.
Merge multi-column questions
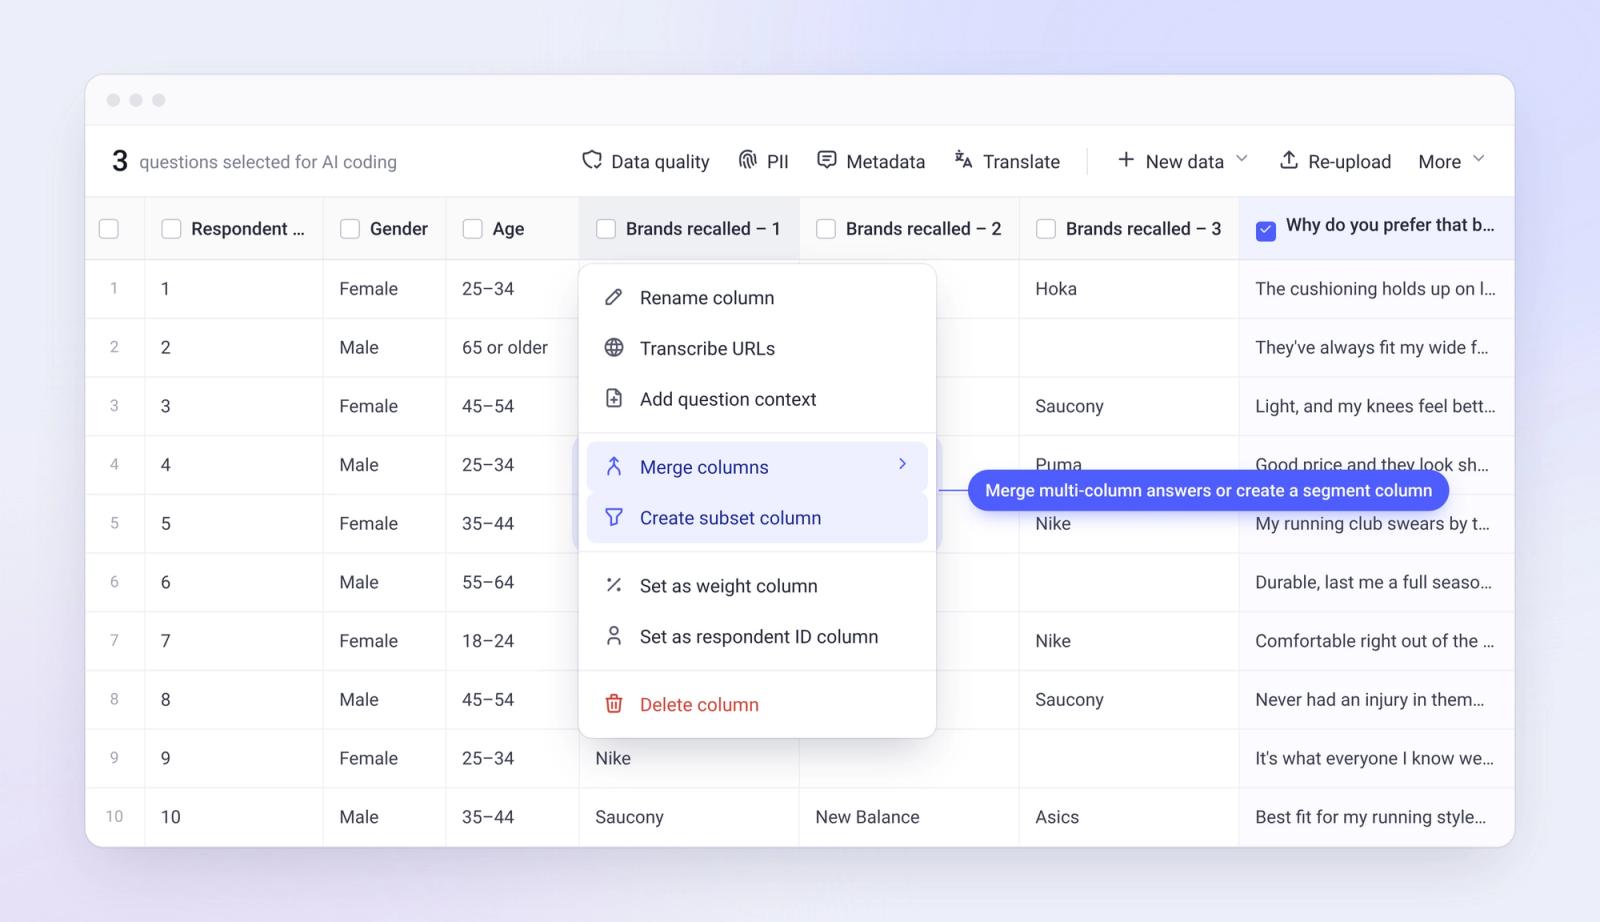
Some questions collect several answers per respondent. Unaided brand awareness is a common example: "Which brands of running shoes can you think of?" In the survey export, each mention usually lands in its own column.
If you want to code those mentions together, merge them into one clean column first. Then code that single column.
Create segment columns before coding
If you only want to analyze one segment's responses, such as female respondents, create a column that contains only those responses and code that column.
You can ask AI to find the segment and code it in one step. But that adds an extra task to every response, and extra tasks pull attention away from the coding itself. You already know who belongs in the segment, so let the data prep handle it.
Step 3: Code the Open-Ended Responses
With clean data in place, it's time to code.
In BTInsights, you select a question from the list of open-ends the platform identified, then make two decisions: which coding mode to use and how to configure it.
Choose a coding mode
There are two options:
- Let AI generate: The AI builds a code frame from the responses. You can set the number of codes yourself or use auto mode, which lets the AI decide the best number for the data. This works well for new studies and exploratory questions.
- Use predefined codes: You bring your own codebook. You can paste codes in, import them with AI, or copy codes from another question you've already coded. This is the right fit for tracking studies and multi-wave projects that need consistent codes.
If you're working from your own codebook, a short description for each code improves accuracy, especially for broad codes. Our guide on building a codebook for open-ended responses goes deeper on that.
Configure each question
The right configuration depends on how the question was asked.
| Setting | Option | Use it when |
|---|---|---|
| Code attribution | Multi-code (default) | Responses often mention several ideas, and every relevant theme should be captured |
| Single-code | You want one primary theme per response and percentages that add up to 100% | |
| Coding type | Thematic | The question asks for opinions, reasons, or experiences |
| Entity (semi-open) | The question asks for names, such as brands, stores, cities, or products |
Entity coding is easy to underestimate. When a Verizon outage hit the US in September 2024, we downloaded more than 700 comments from X where users shared whether their state was affected. Using semi-open (entity) coding, the platform processed them in about 35 seconds and returned a ranked list of the most-mentioned states, with every comment linked to its state.
Thematic coding would have summarized those same comments into broad themes like "service disruption," which answers a different question entirely.
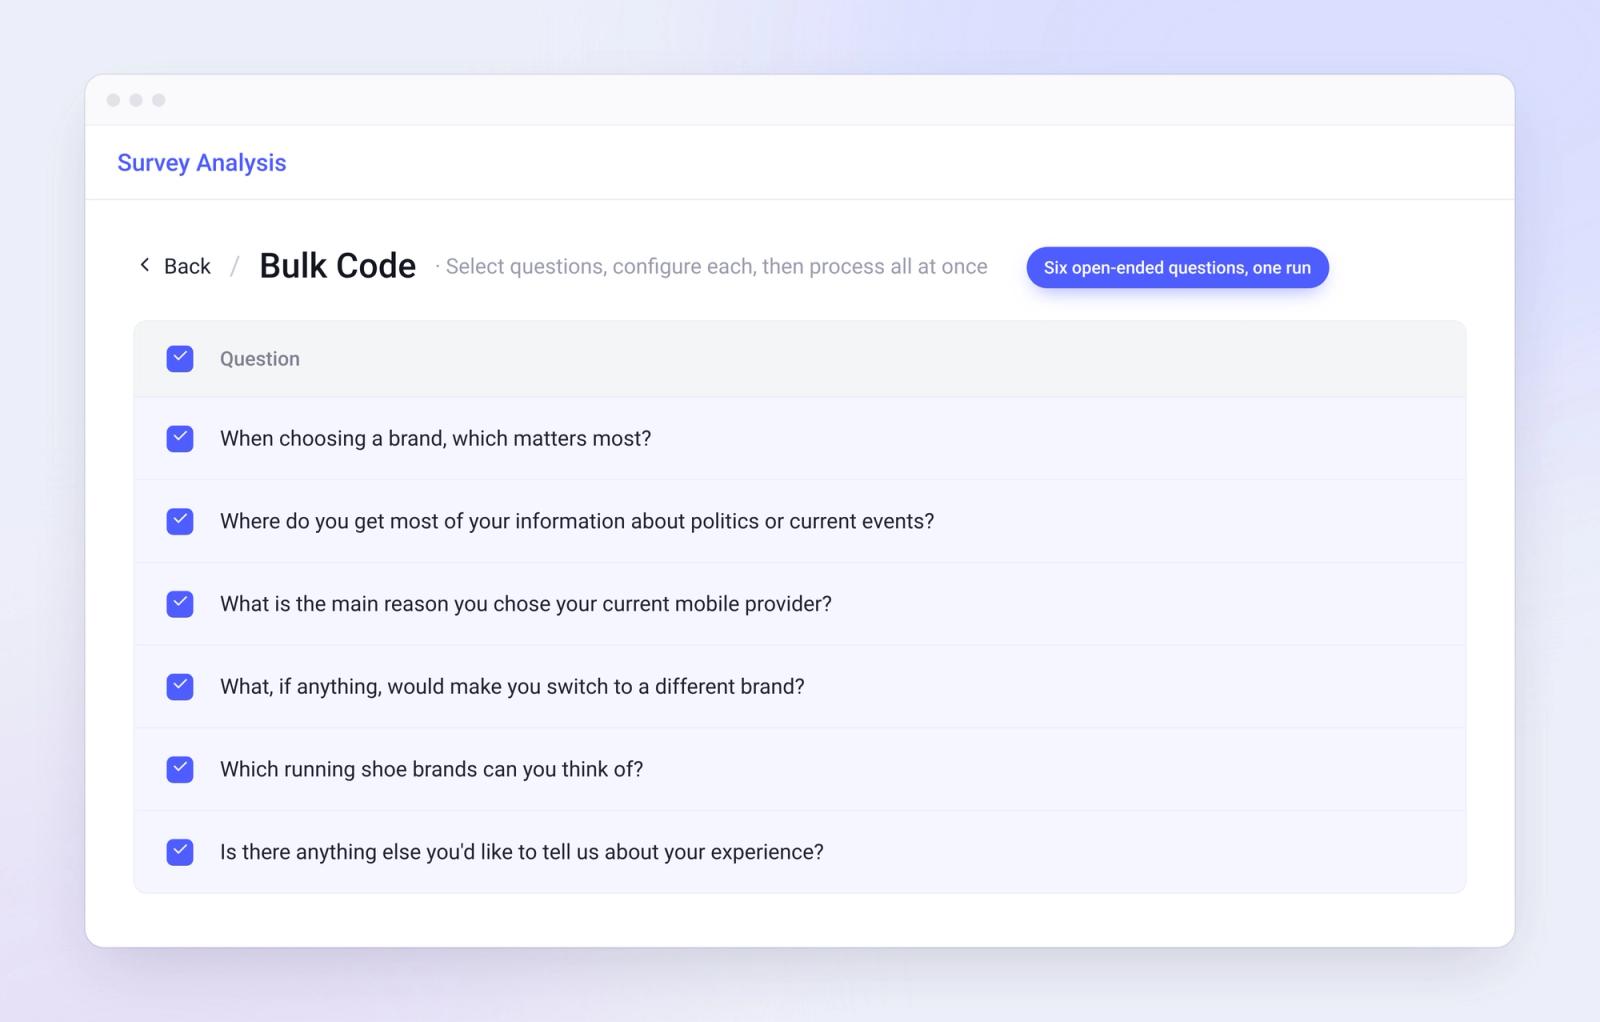
Code many questions at once
Plenty of survey datasets carry 30, 50, or more open-ended questions. Coding them one at a time doesn't scale.
With bulk coding, you set the configuration for each question up front, then process all of them in a single run. Each question typically takes a few minutes, so the whole set can finish while you work on something else:
Step 4: Review and Refine the Codes
AI coding works best as a strong first pass. The researcher still decides what's final.
In BTInsights, the results show each code with its frequency, percentage, and description. Click a code, and you'll see every response assigned to it, with the specific sentences behind the code highlighted. That makes it quick to check whether a code means what it says.
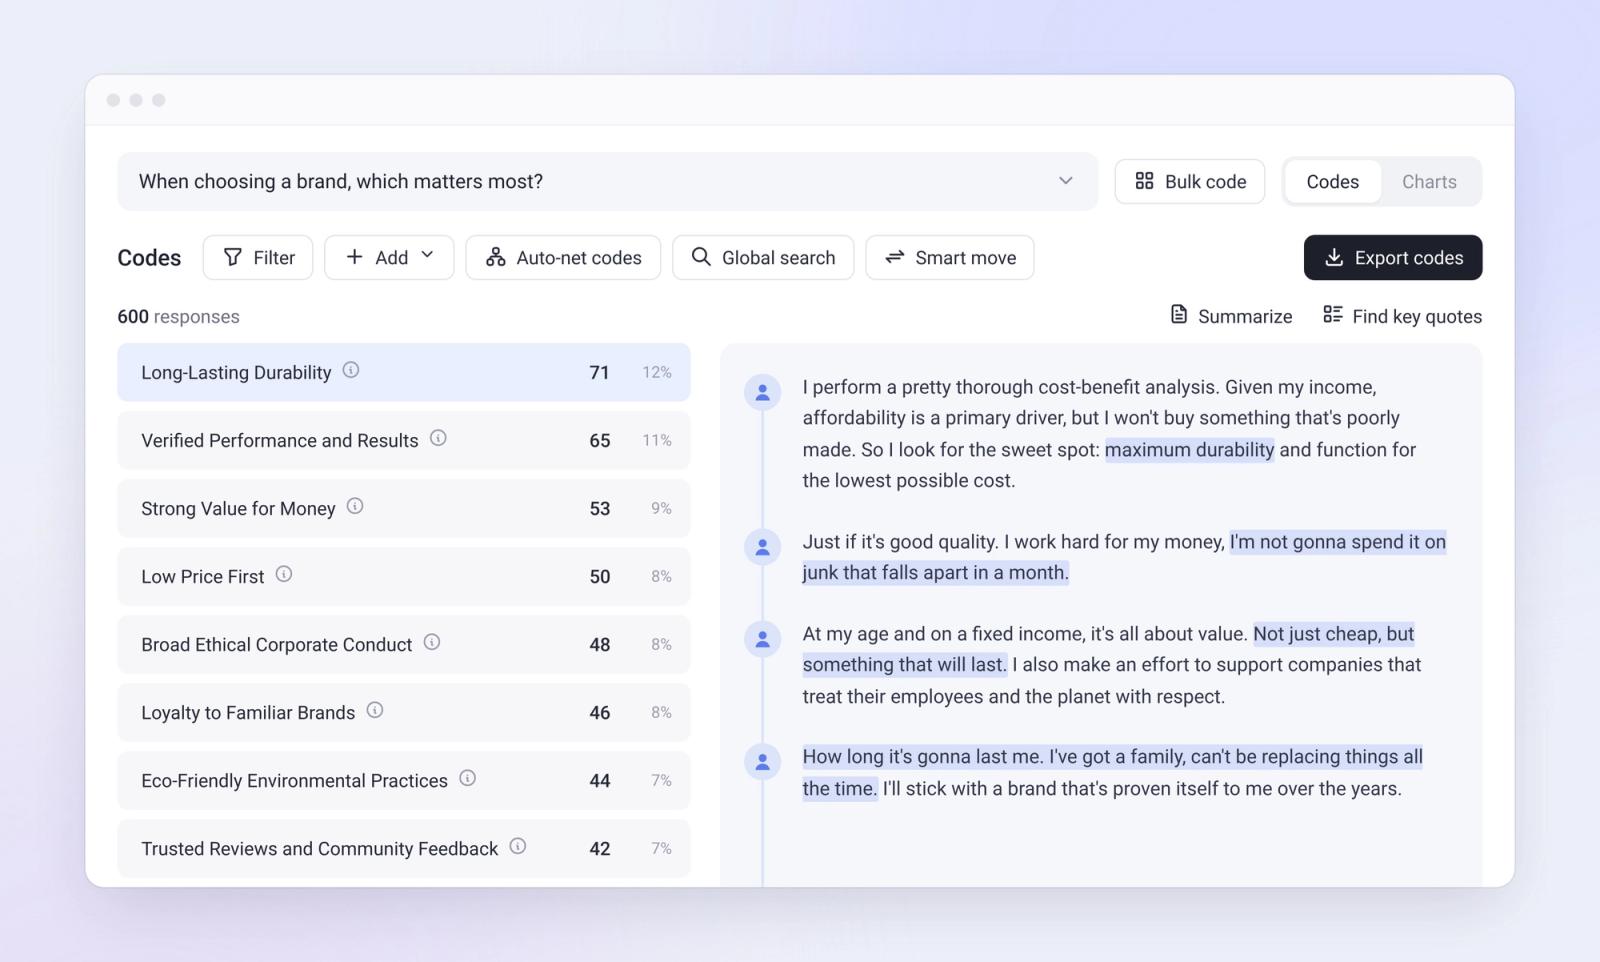
From there, you can:
- Reassign responses by selecting them and dragging them to a different code
- Merge overlapping codes into a single code
- Split a broad code into more specific ones
- Group codes into nets (broader categories), either manually or by letting AI suggest them
- View the other codes a response was assigned to and unassign any that don't fit
For example, a "Product quality" code with 400 responses might be worth splitting into durability, performance, and design. Meanwhile, "Good value" and "Fair pricing" might work better as one code.
Step 5: Export the Coded Data
Once the codes are final, export them in the format that fits your workflow.
BTInsights exports to Excel or SPSS, in dichotomized or undichotomized layouts, with custom formats available on request. Because you uploaded respondent IDs in step 1, every code links back to an individual respondent. That means the coded data can be merged with the rest of the survey in whatever tool your team already uses.
There's also a chart view that displays the codes by custom segments such as gender or age, which you can export straight to PowerPoint.
Step 6: Build Cross-Tabs and Run Significance Testing
Knowing that 32% of respondents mentioned product quality is useful.
Knowing that college graduates mention it significantly more often than other groups is usually what the client actually wants.
That's where cross-tabulation comes in. And it's where many open-ends tools fall short. They code the responses, then leave you to export the codes, re-import them into a separate crosstab tool, and rebuild the link to your demographics. Every extra handoff is another chance for a mismatched column or a missing respondent.
In BTInsights, coded questions show up in the cross-tabulation view with a "coded" label. To build a table, drag the coded question to the rows and a variable like education to the columns. The table shows the base, plus the count and percentage for each code within each group.
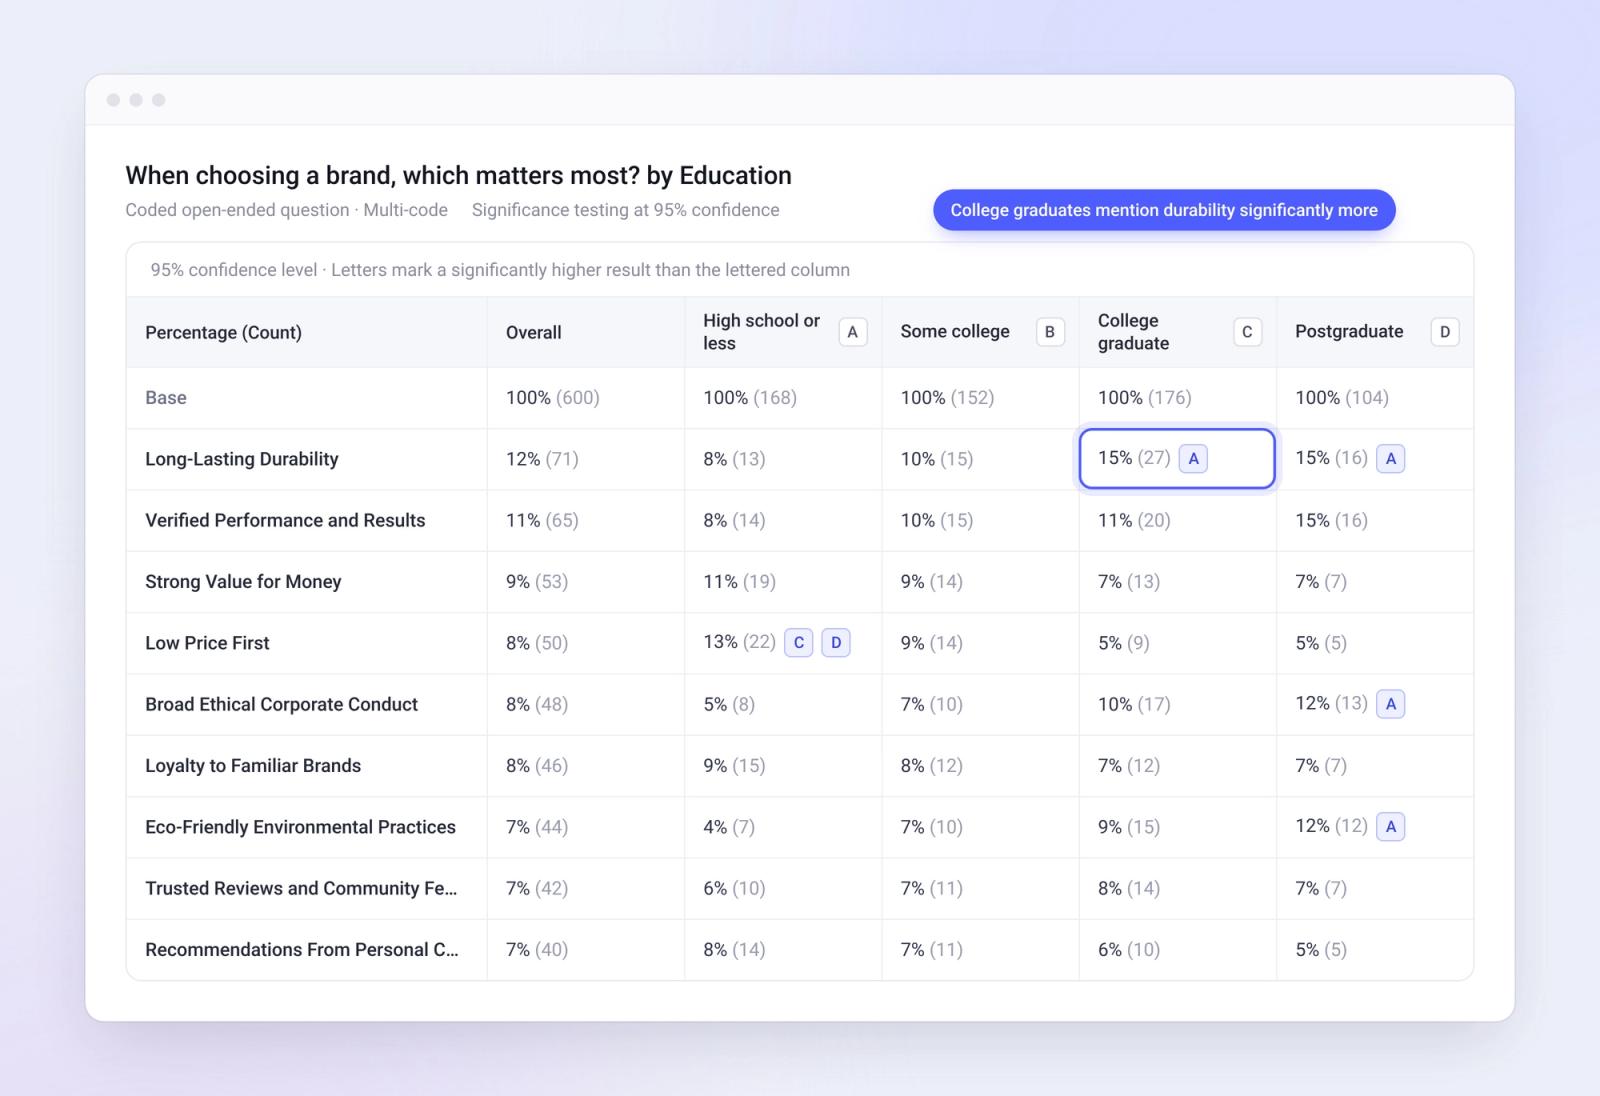
From there, you can:
- Run significance testing and choose the testing method
- Apply weights, which is common in public opinion research and political polling
- Filter a single table or every table at once
- Save banners to reuse the same column variables across tables
- Create tables in bulk, export them, or turn them into PowerPoint slides
Keep in mind that multi-code attribution changes how you read the table. Since one response can carry several codes, the percentages in a column won't add up to 100%.
Not every team needs cross-tabs for open-ends. But when a project calls for segment comparisons, keeping coding and cross-tabs in one place removes the export and re-import step completely.
Step 7: Explore the Data With an AI Research Agent
Coding and cross-tabs answer the questions you planned for, but the real insights come when you dig deeper. Exploratory analysis lets you extract unique, nuanced insights that otherwise wouldn't be possible.
The BTInsights Survey Research Agent lets you ask questions of the full survey dataset in plain language, open-ends included. For example:
- What are the key insights from this survey?
- How do answers to "What matters most when choosing a brand?" differ by gender?
- Which themes come up most among respondents who feel pessimistic about the economy?
The agent builds the cross-tab tables it needs in the background and writes its insights from those tables. Every answer includes a link to view the evidence, so you can see exactly which tables a finding came from.
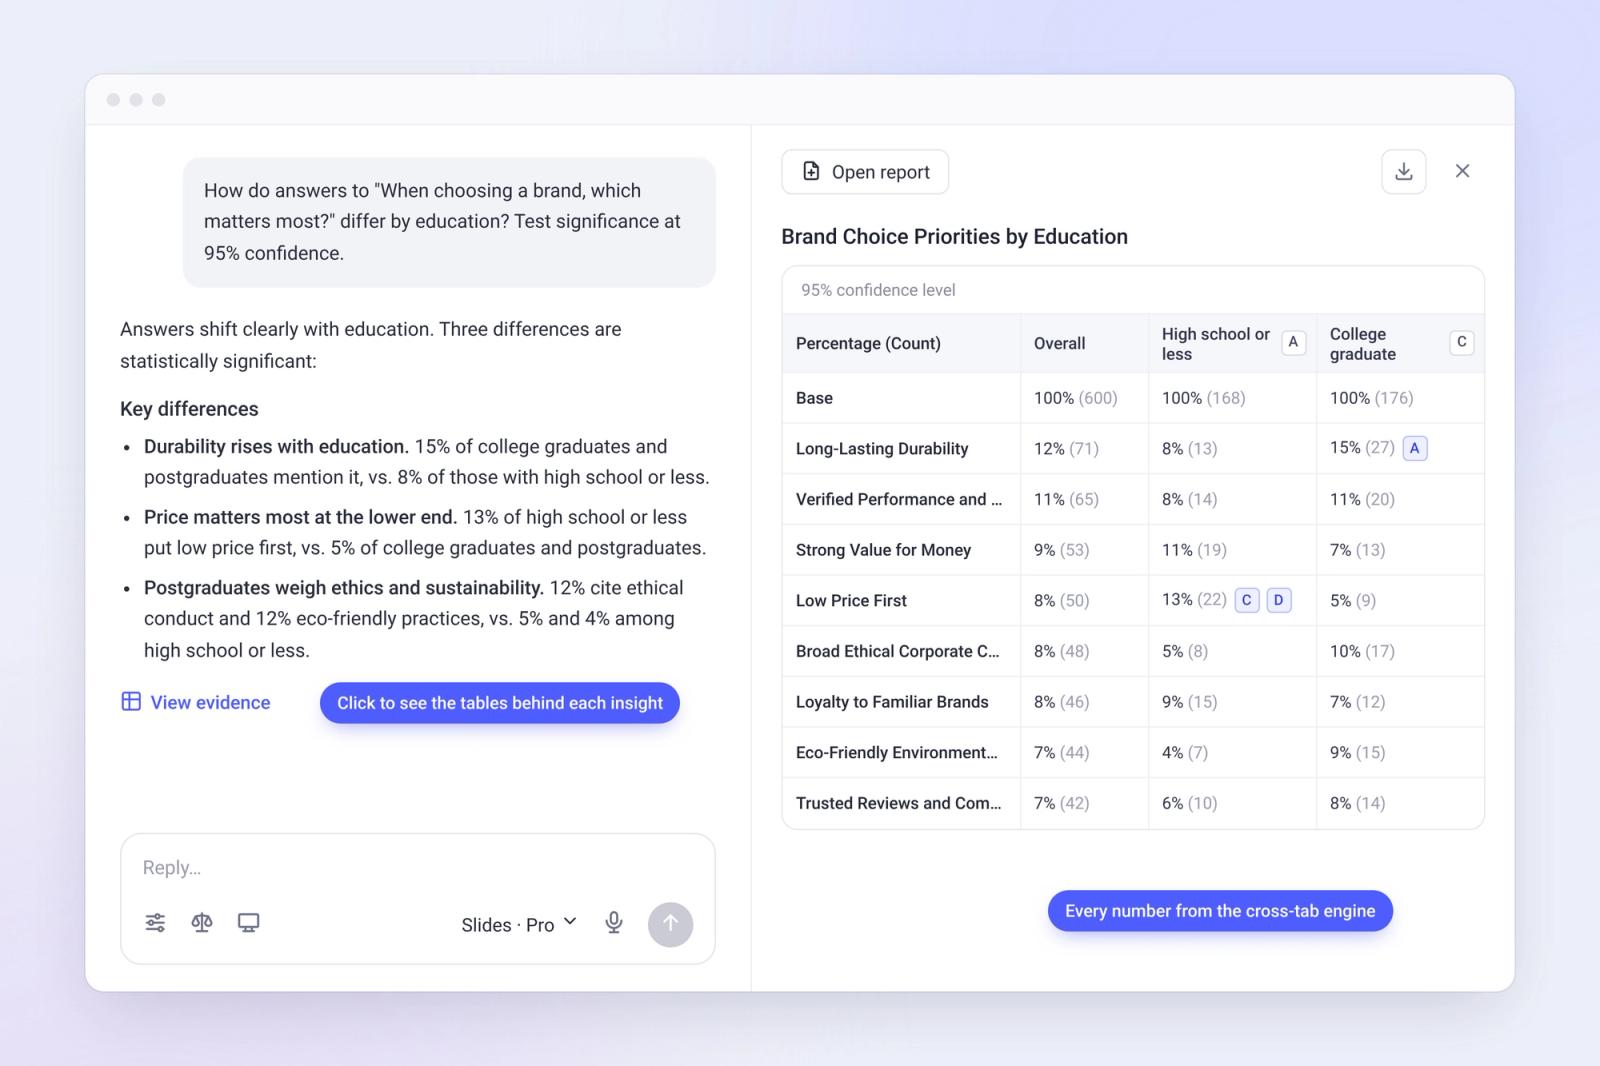
That last part matters more than it might seem. The tables are calculated by BTInsights' cross-tabulation engine, not by the AI, because language models still can't be trusted to do survey math reliably. The AI interprets the results. The engine produces the numbers.
You can also ask the agent to create tables or generate PowerPoint slides from an outline you provide.
What AI Changes About Open-Ended Survey Analysis
Taken together, AI changes open-ended survey analysis in a few concrete ways:
- Speed: Coding that used to take days takes minutes, and bulk coding handles dozens of questions in one run.
- Cost: Without hours of manual work or an outside coding vendor for every question, teams can afford to analyze open-ends far more often.
- Languages: Mixed-language datasets can be translated and coded in one place.
- Depth: Every code links to the responses and highlighted sentences behind it, and themes can be compared across segments in the same workflow.
What AI doesn't remove is the researcher. Someone still has to prepare the data, choose the right configuration, and decide whether a code means what it says. The workflow above is built around that.
From Raw Responses to Findings You Can Stand Behind
Open-ended responses hold some of the most useful information in any survey. Getting it out reliably takes more than fast coding.
Yet most teams still piece the workflow together across separate tools: one for coding, another for cross-tabs, and a spreadsheet to connect them. Every handoff adds time and another chance for error.
BTInsights was built to fix that.
- Clean data before you code. Flag low-quality and AI-generated responses, remove PII, and translate mixed-language datasets.
- Choose the most optimal coding configurations for different use cases. Code with your own codebook or let AI build one; Set thematic or entity coding; Use multi-code or single code attribution.
- Stay in control of the results. Reassign, merge, split, and net codes before anything is final.
- Go straight from codes to cross-tabs. Run significance testing and ask the research agent follow-up questions, with every number calculated by the cross-tab engine.
Book a demo to see how BTInsights handles your own open-ends, then run a free pilot on a real project.