


What is survey text analysis software?
Survey text analysis software organizes, codes, categorizes, and analyzes unstructured text that surveys collect. The software takes the free-text answers respondents type in and turns them into something researchers can measure, compare, and report on.
Typical inputs include:
- Open-ended survey questions
- NPS and CSAT explanations ("What is the main reason for your score?")
- Brand-awareness questions
- Unaided awareness responses
- Product feedback
- "Other, please specify" responses
Survey text analysis is often confused with verbatim coding. Verbatim coding is one component of survey text analysis. Verbatim coding converts responses into structured categories, or codes, so they can be counted and tabulated.
Survey text analysis can take the research beyond coding. It can surface new themes, analyze sentiment, identify entities such as brand names, and compare themes across different respondent groups.
AI also gives researchers room to investigate questions that weren’t considered when the original code frame was created.
For example, if “price” appears more often among younger respondents, a researcher can ask what that group is actually saying about price. That ability to move between structured coding and follow-up analysis is what sets survey text analytics apart.
What should you look for in survey text analysis software?
Here are the features and criteria used to compare the platforms later in this article. As you’ll see, not every project needs all of them, but the more of your workflow a tool covers, the fewer hand-offs and manual steps your team has to manage.
Code frame creation and importing
Make sure you aren’t limited to AI-generated code frames. Researchers should also be able to create their own or upload an existing codebook. That matters for trackers, longitudinal studies, and established research programs where changing the codes between waves can make comparisons difficult.
Single-code and multi-code attribution
Some questions call for one code per response. Many do not.
Suppose you collect this answer: "I like the price, but customer service takes too long."
A multi-code system can assign both Price/Value and Customer Service. If you forced that response into a single category, you would have lost half of what the respondent told you.
Entity and non-entity coding
Different questions need different approaches.
"Which brands come to mind when you think about athletic shoes?" is an entity question, and the job is to extract and standardize brand names, including misspellings and nicknames. "Why did you choose your current athletic shoes?" is a non-entity question. In this case, the job is to identify reasons and motivations. The best software handles both types of question.
Human-in-the-loop review
AI coding should be a starting point that researchers can inspect and adjust.
Look for the ability to:
- Review code assignments response by response
- Edit, rename, merge, and split codes
- Move responses between codes
- Approve AI-generated coding before it goes into analysis
Researcher control and auditability matter more than raw automation. You’re the one presenting the findings to a client or stakeholder, so you need to be able to stand behind every number.
Multilingual survey analysis
International studies can bring together responses in many different languages. The software should apply one consistent code frame across them, so the same theme is categorized the same way in German, Japanese, and every other language in the study.
Crosstabs and significance testing
Codes become far more valuable when you can treat them as variables.
Look for these features:
- Crosstabs against demographics and other survey questions
- Filters and segments
- Statistical significance testing
- Counts and percentages
- Clearly reported base sizes
This is one of the clearest dividing lines between dedicated research tools and general-purpose AI text analysis software.
Export options
Results need to fit your existing workflow.
Typically, that means offering outputs like:
- Excel
- CSV
- Formatted tables
- Files for tools like SPSS and Q
- Research reports and presentation-ready slides
Flexible AI exploration
Can you ask follow-up questions of your survey responses, or are you limited to a fixed list of codes? For example:
"Why are respondents aged 18 to 34 dissatisfied with Product A?"
This kind of conversational analysis is one of the biggest shifts in modern AI text analytics for surveys. Traditional automated coding answers the questions you planned, but flexible exploration helps with the ones that come up once you see the data.
Traceability and quality control
Check whether you can trace findings all the way back to individual verbatims. When the source responses are always within reach, researchers can verify AI-generated insights and see whether the data really supports the conclusion.
Best Survey Text Analysis Software for Market Research
Here’s how the eight platforms compare on the criteria above. Keep in mind that these features change often, so confirm current capabilities with each vendor before you buy.
| Platform | Best for |
|---|---|
| BTInsights | End-to-end survey text analysis |
| Displayr | Cross-tabulation with survey text analysis |
| Qualtrics Text iQ | Existing Qualtrics users |
| Codeit | Traditional verbatim coding |
| Thematic | Automated theme discovery |
| Enterpret | Large-scale feedback analytics |
| Chattermill | Voice-of-customer analytics |
| SurveyMonkey | Straightforward survey text analysis |
| Platform | Code frames | Multi-coding | Human review | Multilingual | Crosstabs & significance testing | AI exploration |
|---|---|---|---|---|---|---|
| BTInsights | Yes | Yes | Yes | Yes | Yes | Yes |
| Displayr | Yes | Yes | Partial | Yes | Yes | Partial |
| Qualtrics Text iQ | Yes | Yes | Yes | Yes | Partial | Partial |
| Codeit | Yes | Yes | Yes | Yes | Partial | Partial |
| Thematic | Partial | Yes | Yes | Yes | Partial | Yes |
| Enterpret | No | Yes | Yes | Yes | Partial | Yes |
| Chattermill | No | Yes | Yes | Yes | Partial | Yes |
| SurveyMonkey | Partial | Yes | Yes | Partial | Partial | Yes |
1. BTInsights: Best for end-to-end survey text analysis
BTInsights brings the main stages of open-ended survey analysis together for market researchers. Teams can code responses, review the results, and turn the coded data into something they can analyze and report on, all within the same platform.
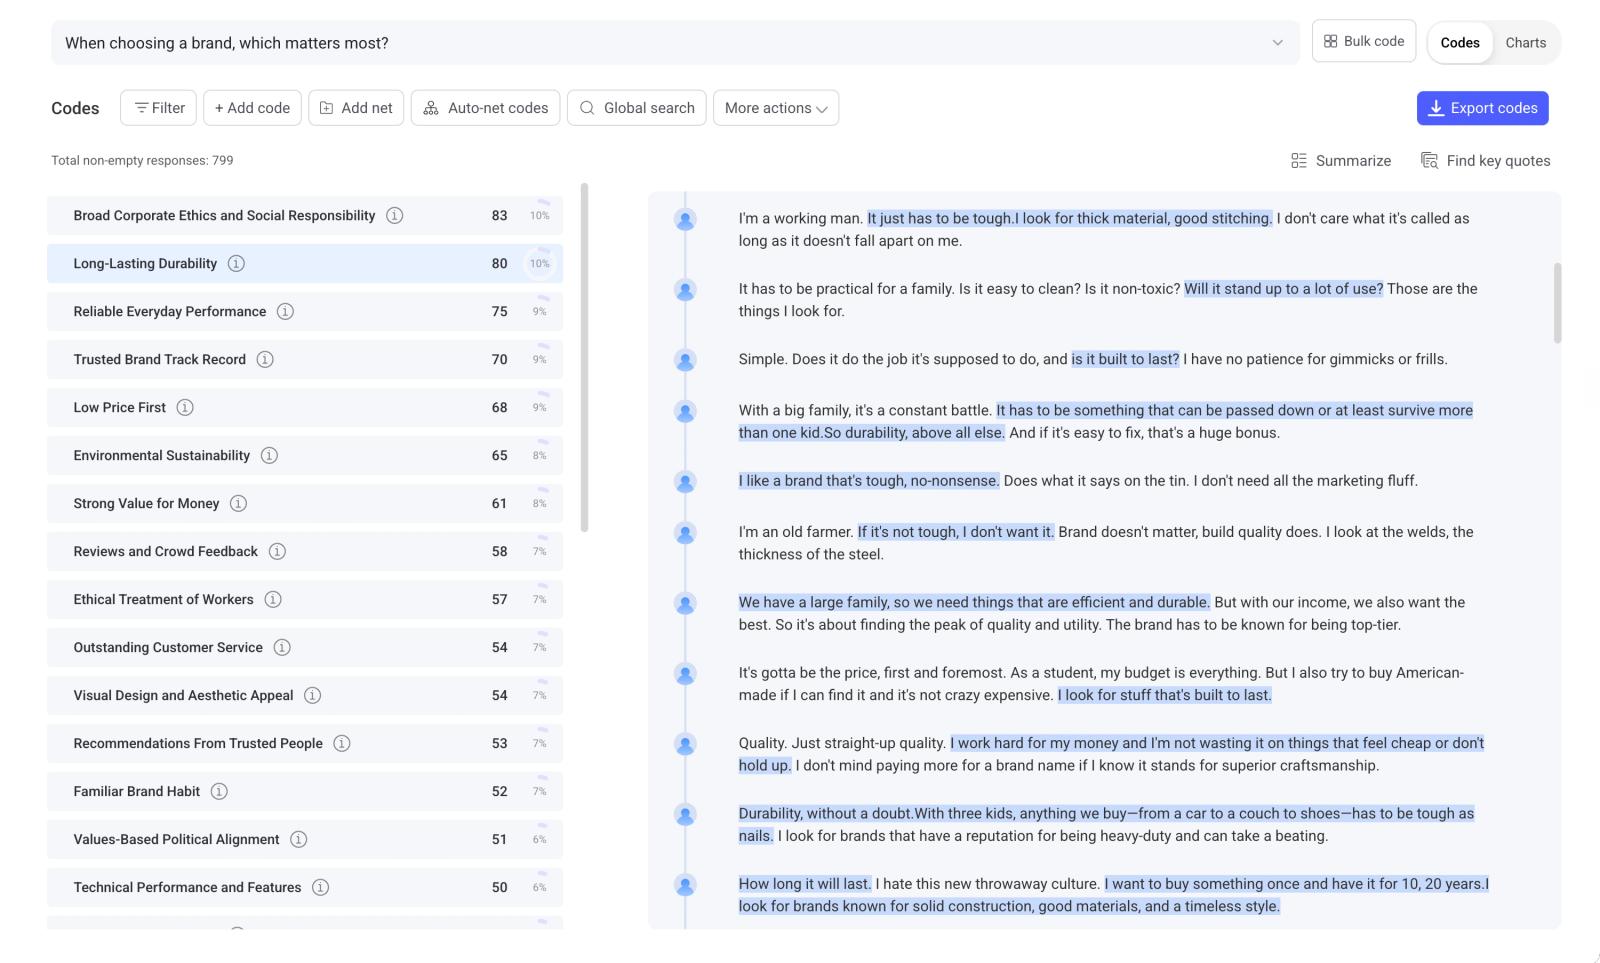
- Code frames your way: Let AI build a code frame from your responses when you’re starting from scratch, or upload an existing codebook and have responses assigned to your predefined codes. Using your own codebook also helps keep coding consistent from one tracking wave to the next.
- Single-code, multi-code, and entity coding: You can assign a response to one code or several, allowing answers with multiple ideas to retain their meaning. BTInsights can also extract entities such as brands, locations, and policies while recognizing different names for the same entity, including “New York City” and “Big Apple.”
- Researcher control: Researchers can inspect and adjust the AI’s work at any point. Codes can be split, merged, renamed, and grouped into categories, while individual responses can be moved when needed. Themes also link back to the source responses for easy verification.
- Multilingual analysis: The platform codes and translates responses in more than 50 languages. As a result, it’s much faster to process multi-market studies consistently.
- Beyond coding: This is where BTInsights stands apart. Coded data can go straight into crosstabs and significance testing to compare themes across segments. Researchers can then return to the qualitative responses and ask follow-up questions in a chat interface, such as why a particular segment feels the way it does. The platform connects the quantitative "how many" with the qualitative "why" instead of stopping at a coded file.
- Research-friendly exports: Results export in formats compatible with SPSS and Q, and BTInsights offers custom export formats at no extra cost. Through its latest slide generation tool, crosstabs can also be turned into editable PowerPoint slides that match your own template.
Data is encrypted in transit and at rest; the platform is SOC 2 Type II audited and customer data is never used to train AI models.
Explore BTInsights survey text analysis.
2. Displayr: Best for advanced cross-tabulation with survey text analysis
Displayr is a survey analysis and reporting platform best known for its advanced cross-tabulation, statistical analysis, and dashboarding capabilities. Its survey text analysis features complement these tools, making Displayr a good fit for researchers who primarily need robust quantitative analysis but also have open-ended responses to analyze.
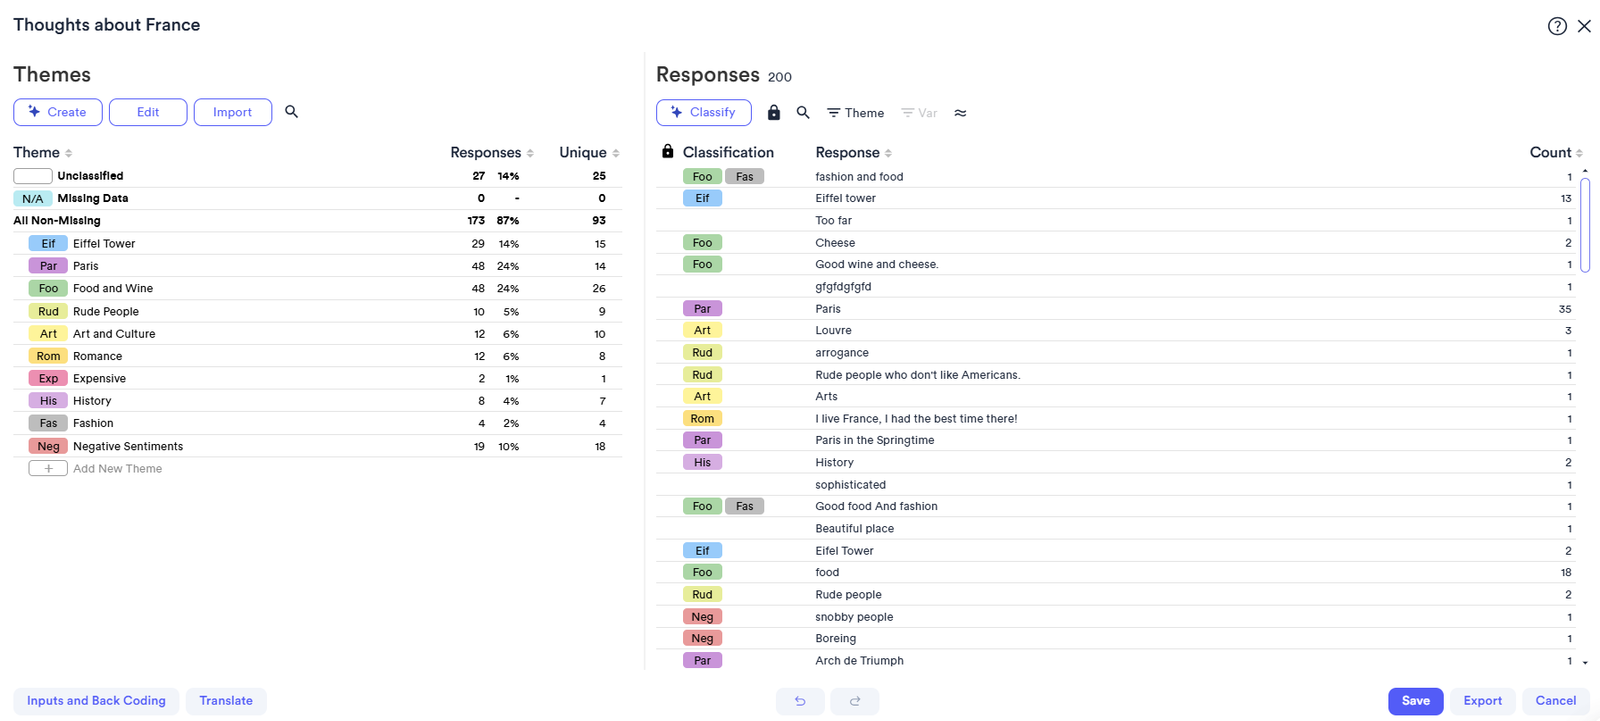
Displayr’s AI can automatically identify themes in open-ended responses and classify text into either a single theme or multiple themes per response. Researchers can reuse existing code frames across variables and documents. It provides limited reviewing and editing functionalities.
One of Displayr’s biggest advantages is that coded text can be analyzed alongside the rest of the survey data. Researchers can incorporate categories into crosstabs, apply weighting and significance testing, create visualizations, and export results to PowerPoint, PDF, or Excel or share them through dashboards. Displayr also supports custom AI prompts for tasks such as sentiment analysis, entity extraction, and categorization.
For teams with sophisticated cross-tabulation and reporting requirements, Displayr provides a convenient way to analyze open-ended responses within the same environment. However, teams looking primarily for a dedicated, robust survey text coding workflow may find its text analysis capabilities less specialized than platforms built specifically for open-ended response analysis.
3. Qualtrics Text iQ: Best for existing Qualtrics users
Text iQ is the text analysis module inside Qualtrics. Its biggest advantage is that open-text analysis happens right next to the rest of your Qualtrics survey data.
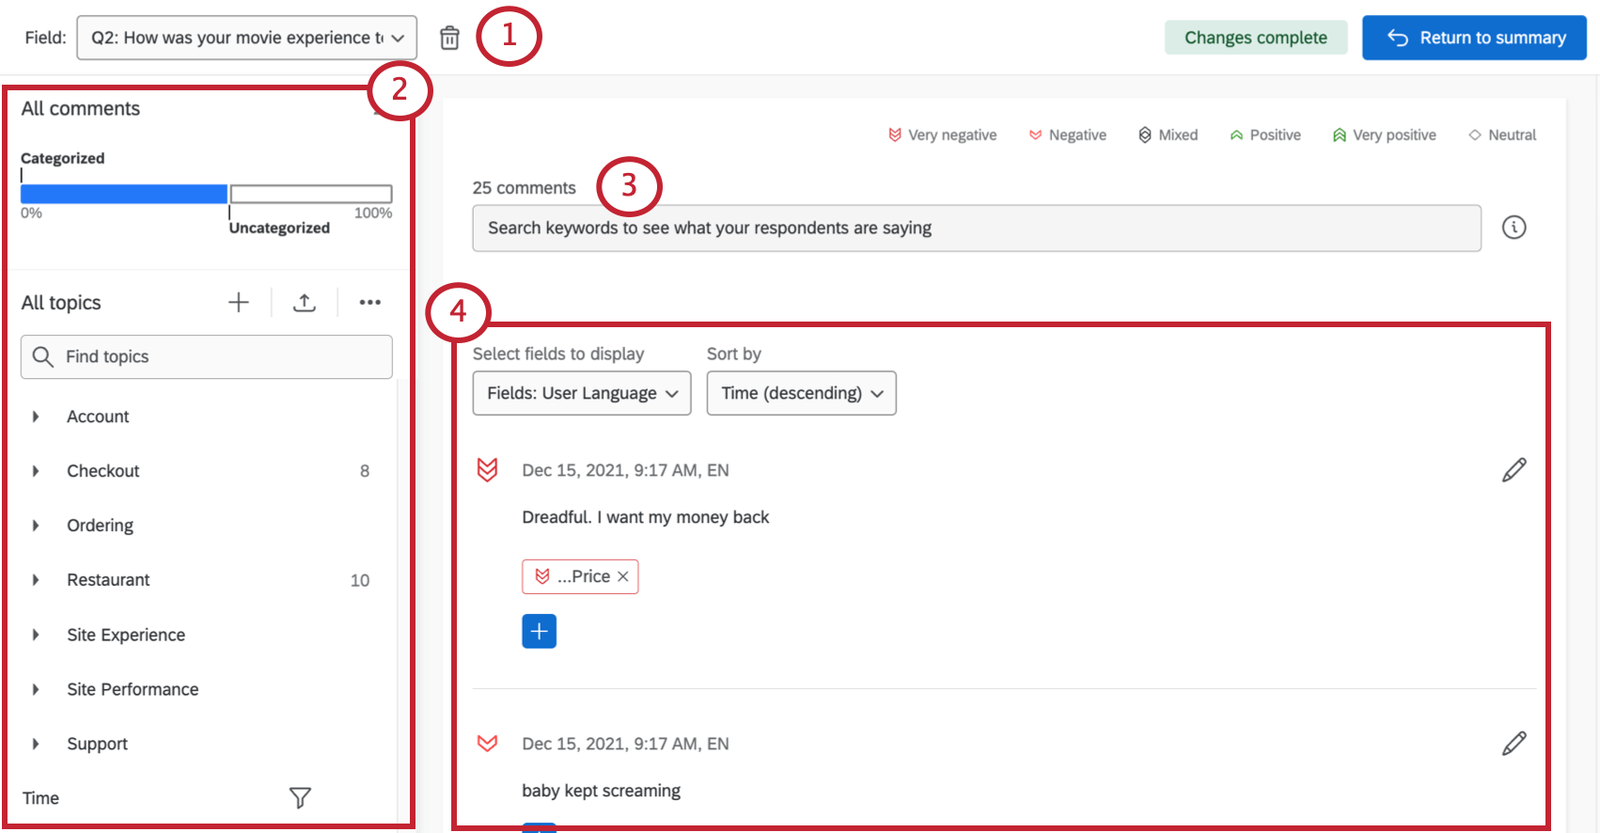
Researchers create topics by tagging responses manually, building search-based queries or, on Advanced plans, accepting recommended topics. Topics can be organized into hierarchies, a single response can carry several topics, and topics can be imported from previous analyses or Qualtrics starter packs.
Sentiment analysis is included, and topic features support a defined list of languages, including English, French, German, Spanish, Portuguese, Japanese, Dutch, Thai, Simplified Chinese, and Korean.
Text iQ variables can be analyzed in Stats iQ, where researchers can relate topics and sentiment to satisfaction scores, demographics, and other variables. Much of the topic-building relies on queries and keyword logic. In turn, getting clean, nuanced coding can take more manual setup than purpose-built AI coding tools. It works best for organizations already committed to the Qualtrics ecosystem.
4. Codeit: Best for dedicated survey verbatim coding
Codeit is a purpose-built platform for coding and analyzing open-ended responses from market research surveys. It is one of the largest incumbents with tools that fit traditional manual coding workflows very well. Market researchers can use the tool to develop code frames and manually review responses. It has recently added some AI capabilities to help automate coding, but its AI-assisted open-ends coding is relatively more limited compared with the AI-native open-ends coding platforms. Researchers can review and refine AI-generated codes, while machine learning can apply previously established coding to new responses, making it useful for recurring and tracking studies.
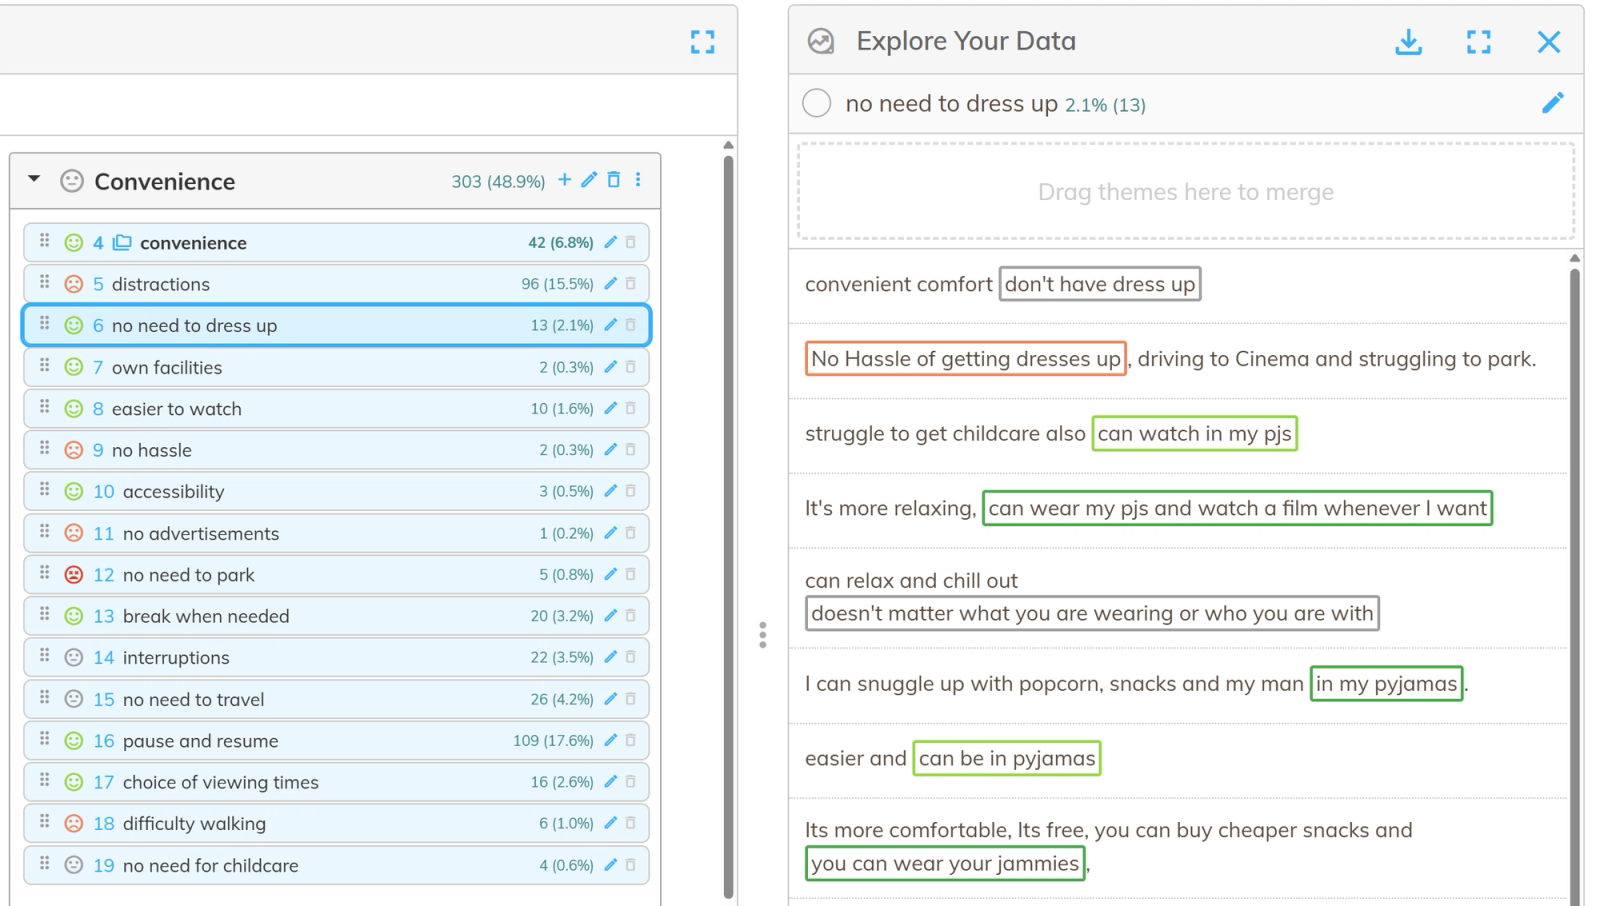
Codeit also supports brand and entity coding, complex survey structures, collaboration between multiple coders and automated translation across more than 130 languages. Its AI tools can identify themes and help build code frames, while Deep Dive allows researchers to explore survey data using natural-language questions, compare groups and generate summaries and charts.
Codeit is a strong fit for research agencies and teams that need a specialized environment for high-volume or recurring open-end coding and for the teams who’d prefer a more traditional open-ends coding workflow. Its focus is narrower than all-in-one survey platforms such as BTInsights or Qualtrics, so teams that also need advanced quantitative analysis, crosstabs and broader reporting capabilities may need to use it alongside other tools.
5. Thematic: Best for automated theme discovery
Thematic uses AI to discover themes directly from the language in customer feedback, without requiring a predefined taxonomy. Themes are organized hierarchically, and each comment can be tagged with more than one theme. Within a theme editor, stakeholders can refine the output by merging, renaming, splitting, removing, and creating themes.
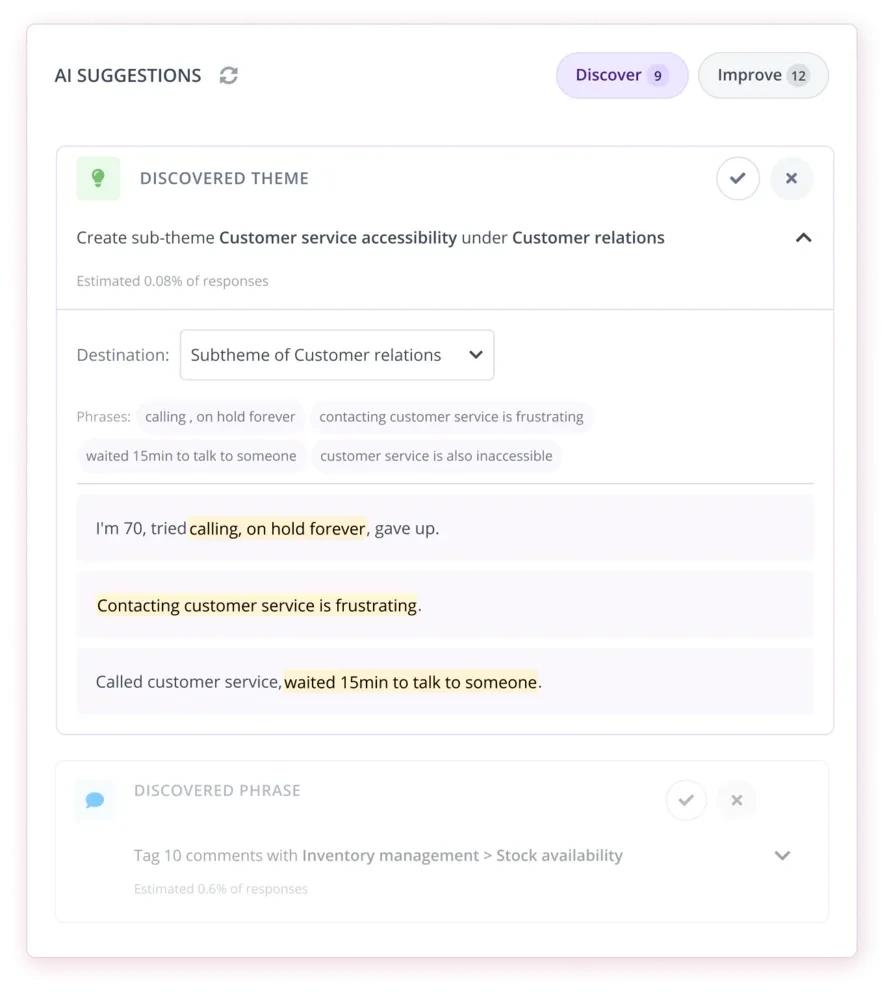
Features include sentiment analysis, built-in translation, segment comparisons, and statistical significance testing. Its Answers feature lets users ask natural-language questions about their feedback.
Automated theme discovery takes a different approach from a traditional code-frame workflow. The AI identifies the initial themes, then researchers review and refine them. That works well for exploratory research, but teams using client-supplied code frames or tracking studies may need more control from the start.
6. Enterpret: Best for analyzing feedback across multiple sources
Enterpret is a customer feedback intelligence platform that unifies tickets, surveys, calls, and reviews, and its standout feature is Adaptive Taxonomy. This tool automatically organizes feedback into a multi-level hierarchy of product areas, features, and themes, learns from new feedback over time, and lets teams update classifications and structure in the interface.
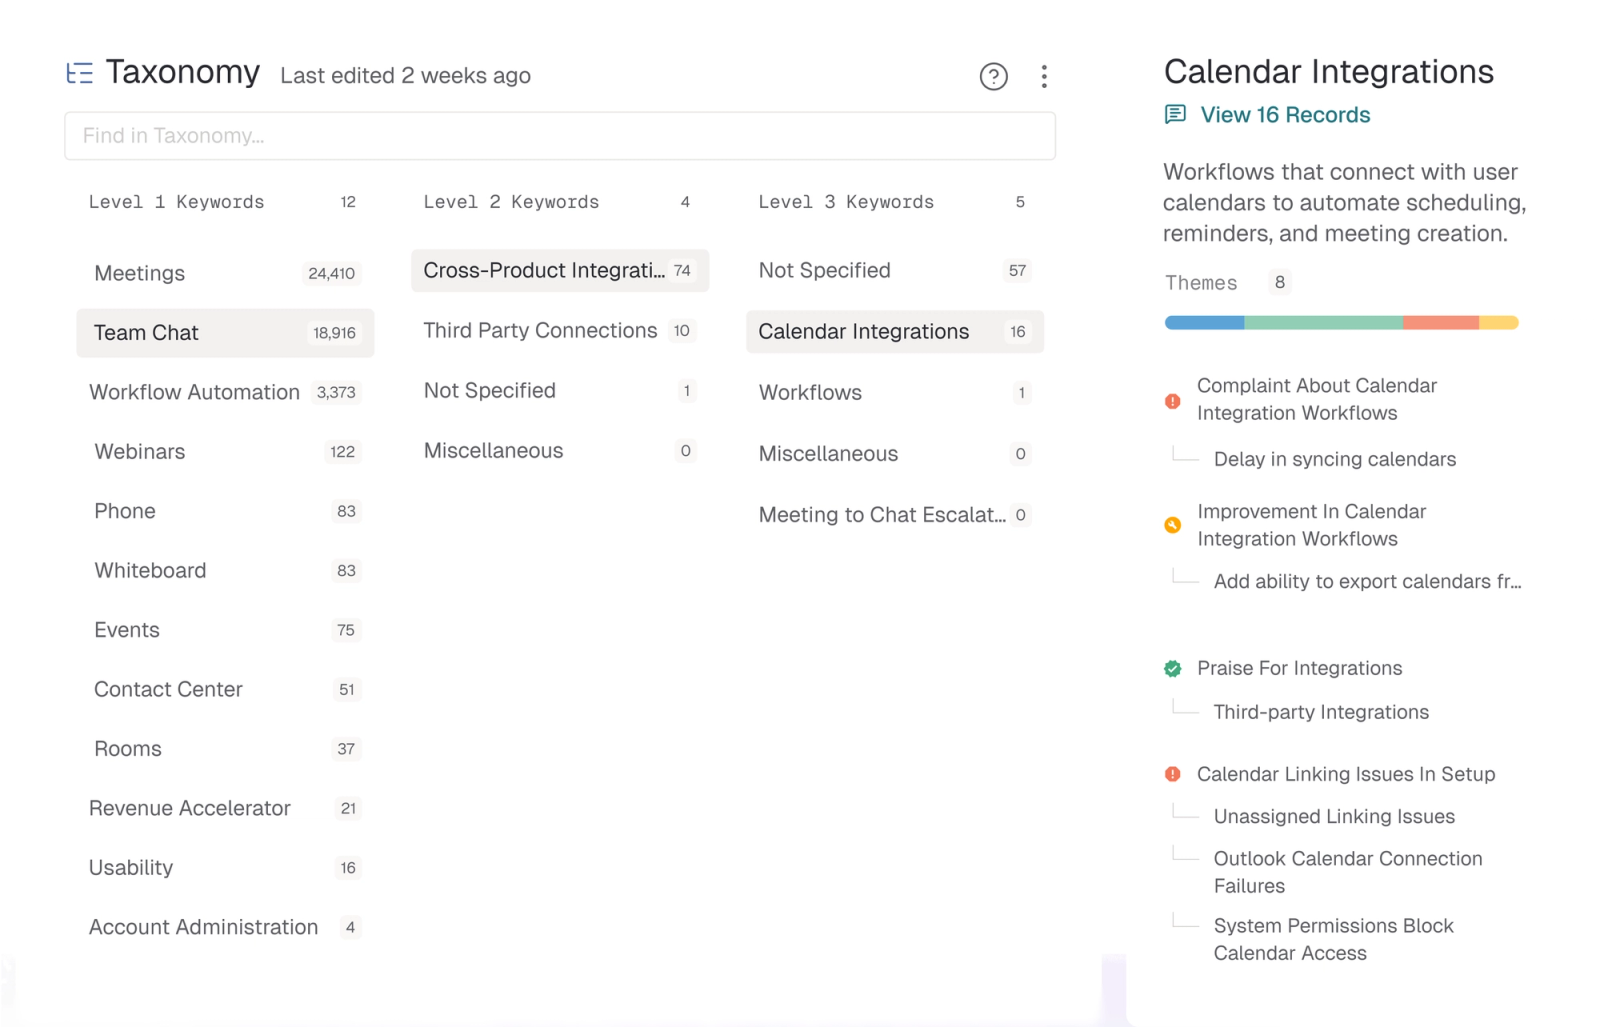
Enterpret is well suited to product and voice-of-customer teams that need to analyze a steady stream of feedback at scale. It covers more than survey data, with public documentation focused largely on product feedback rather than traditional research outputs such as crosstabs, significance testing, and imported code frames. Market research teams should confirm that it supports the outputs their projects require.
7. Chattermill: Best for voice-of-customer analytics
Chattermill is a customer intelligence platform that brings together feedback from surveys, reviews, support chats, and calls across more than 65 channels. It automatically tags feedback into a taxonomy, applies aspect-based sentiment analysis, and supports more than 100 languages with automated translation.
Its Lyra AI agent surfaces trends and answers custom questions with supporting customer quotes, and the platform includes impact analysis, anomaly detection, and segmentation by channel, location, and customer data.
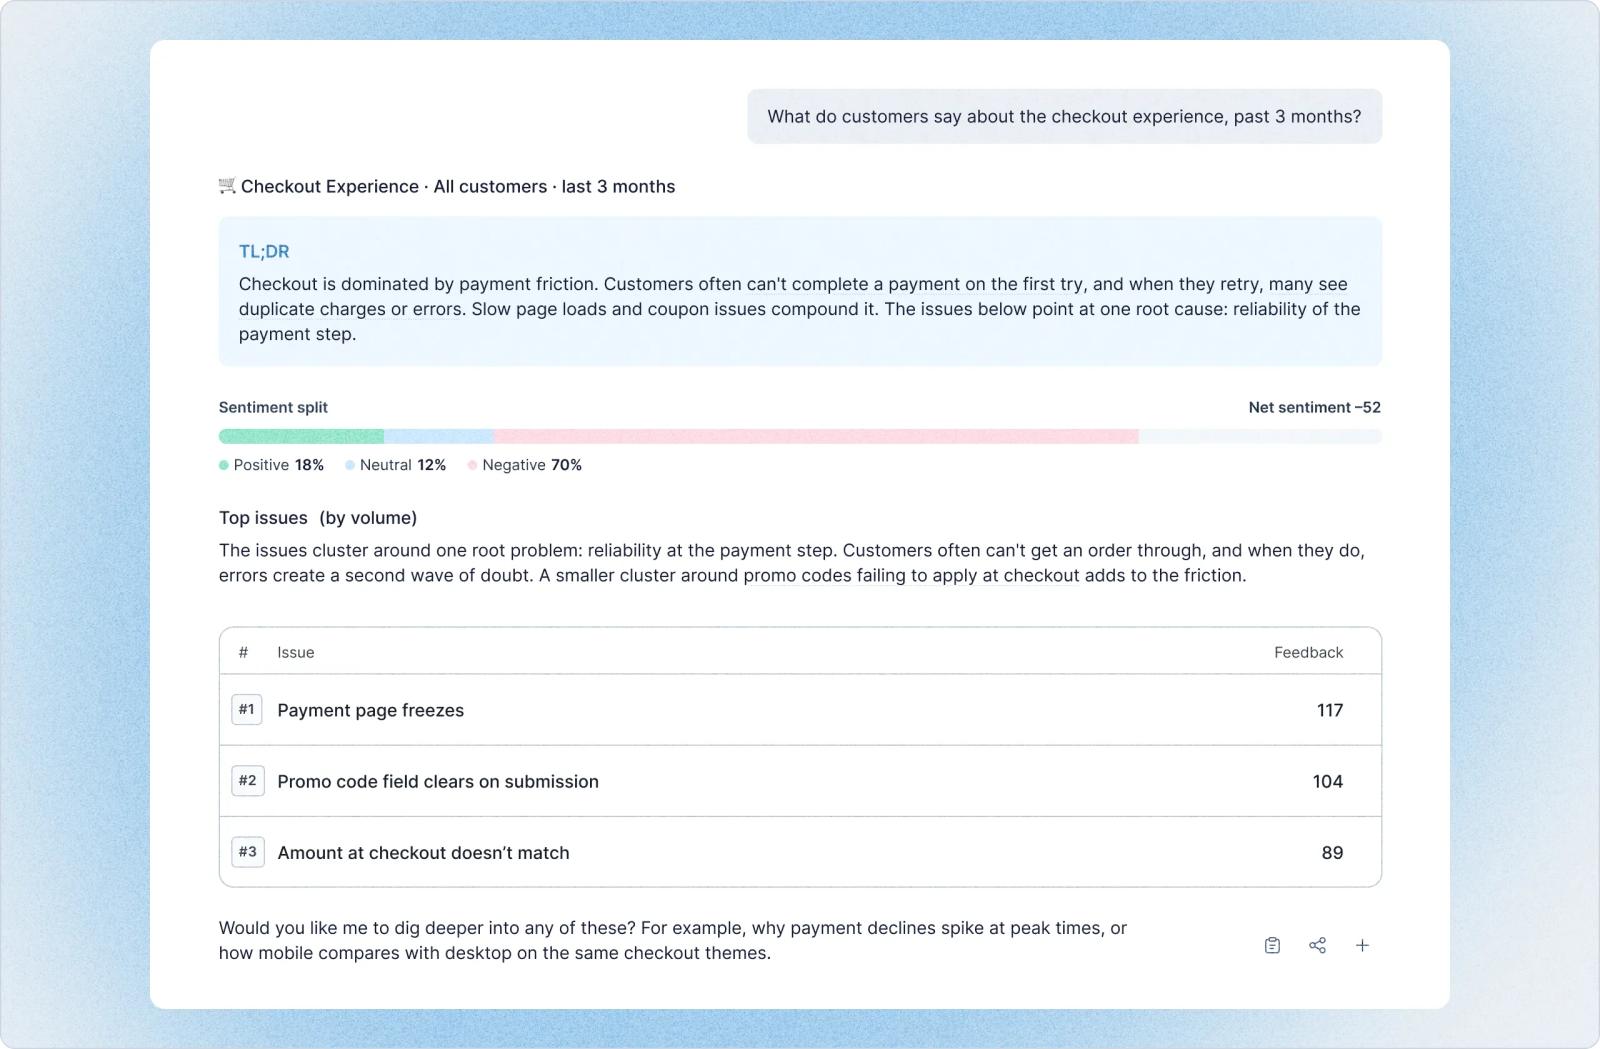
Chattermill is designed for ongoing CX and VoC programs, with dashboards that track NPS, CSAT and sentiment over time. That differs from a market research survey workflow built around a specific study, a code frame, crosstabs, and client deliverables. Research agencies will likely find it less suited to project work, but it could be a realistic fit for in-house CX teams.
8. SurveyMonkey: Best for straightforward survey text analysis
For teams already collecting data in SurveyMonkey, its built-in tools offer a convenient starting point. Researchers can tag responses manually, run AI thematic analysis to group comments into key themes, apply sentiment analysis, and filter responses by theme. The Analyze with AI feature lets users ask questions in plain language and get summaries, charts, and segment comparisons.
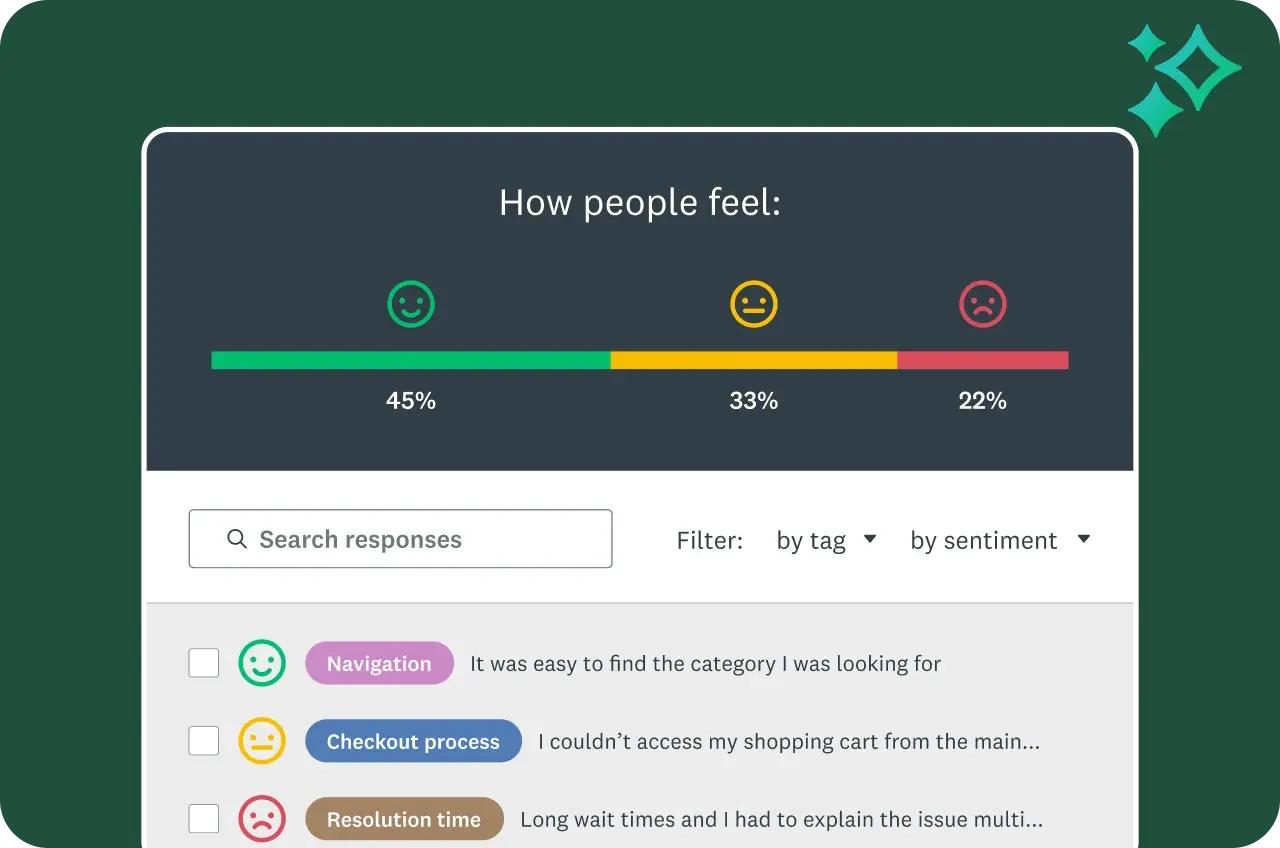
Responses can be exported to XLS or CSV with tags, themes, and sentiment included. There are limits to consider. Thematic analysis and Analyze with AI are paid features, currently support English-language surveys only, and handle up to 10,000 responses. There’s no documented way to upload an existing code frame for AI coding.
SurveyMonkey fits simpler projects where speed and convenience matter more than detailed coding control.
How to Choose Survey Text Analysis Software
Here are seven suggested steps to follow that will narrow down your shortlist.
1. Define the output you need
Decide whether your deliverable is mainly codes, crosstabs, themes, reports, or broader qualitative insights. A CX dashboard and a client-ready research report call for very different tools.
2. Determine how much control researchers need
Automated theme discovery works well when you want to quickly see what comes through in the data. For trackers, established research programs, or client-supplied codebooks, researcher-controlled code frames give you more consistency from one study to the next.
3. Test coding complexity
Test the platform with some of your harder responses before deciding on a single platform. Include ambiguous answers, responses with several themes, entity questions, and comments that only make sense with additional context.
4. Evaluate human review capabilities
Researchers need to be able to see exactly how each response was coded so they can step in when something looks wrong. They should also be able to reorganize the code frame without starting from scratch.
5. Determine downstream analysis
How smoothly does the platform move from coding into analysis? You should be able to turn codes into variables and use them for crosstabs, segments, and statistical tests from the get-go.
6. Check language and export requirements
Check language coverage and export options before you get too far into your evaluation. Review the languages required for upcoming projects. Can results move into tools like Excel, SPSS, Q, and PowerPoint?
7. Test the software using real survey responses
Run a trial with a representative sample of your own data, including ambiguous, detailed, and multi-theme answers. A clean demo dataset will make almost any tool look good.
Conclusion
The best survey text analysis software does much more than summarize comments automatically. For market researchers, open-ended data only becomes valuable when it’s coded accurately, checked by a researcher, measured across segments, and explored in enough depth to explain the results.
That means finding a platform that supports the complete workflow:
Coding → Human validation → Quantitative analysis → Qualitative exploration → Reporting
Tools built for CX dashboards or quick theme summaries can cover parts of that chain. Market research teams get the most value from software designed around all of it, from the first code frame to the final client deliverable.
Eager to explore how BTInsights helps market research teams code, validate, and analyze open-ended survey responses with AI? Book a demo today!