
Survey data is one of the richest resources for understanding customer opinions, employee sentiment and market trends. But raw survey results can be overwhelming, especially when you’re dealing with open-ended responses at large scale. That’s why finding the right AI tools can substantially increase your team’s efficiency, reduce costs and give your team unfair competitive advantages.
Before diving into the 7 best AI tools, we need to define the core criteria for choosing the right survey analysis tool.
6 Major Factors to Consider
- Cross-tabulation and segmentation: Good AI tools should support easily building cross-tab tables so that you can slice and dice survey results by different demographics or variables, which is critical for uncovering deeper insights. There are lots of large survey analysis platforms that have this functionality but are very clunky and slow in integrating AI, so make sure to find a platform that is more AI native with better user experience and workflow.
- AI-driven open-ended analysis: We all know it can be a nightmare to analyze open-ended survey responses, especially thousands of them, which takes lots of time and resources. The ability to automatically code open-ended responses into themes, sentiment or topics is critical.
- Visualization & Reporting: Analyzing the survey data is only part of the job. The final goal is to be able to put together a report so that you can communicate with your internal or external stakeholders. Therefore, you should look for platforms that can turn survey data into charts, dashboards or even slide decks in formats you can customize.
- Ease of Use: Intuitive interfaces that don’t require advanced technical skills will save teams time and training costs. And trust me, it can be very difficult for you to drive adoption internally if the platform is not easy to use.
- Export format: Especially for coding the open-ended survey responses, since quite often we need to export them into certain formats such as Excel, SPSS or Q for further analysis. Therefore, the best AI survey open-ends coding tool should allow you to export the survey coding results in your preferred format.
- Data security and compliance: Especially important if you’re dealing with sensitive employee or customer data.
8 Best AI Tools for Analyzing Survey Responses.
1. PerfectSlide – the best AI-native survey analysis platform
Best for: Consulting, market research and insights teams that need a single AI-native platform to analyze both qualitative and quantitative survey data and ship reports fast.
Key features
- AI-powered open-ended analysis. PerfectSlide has a comprehensive set of features to code open-ended survey responses with high accuracy and consistency. The platform can also auto-translate survey responses in other languages.
- Hundreds of crosstab tables in minutes. Unlike traditional survey tools, PerfectSlide has a very easy-to-use cross-tab generation functionality that allows you to either create crosstabs in bulk or create custom cross-tab tables through easy drag and drop. You can also apply filters or weights.
- Client-ready slides automation. Unlike other platforms that convert tables into images or poorly formatted PowerPoint slides, the PerfectSlide platform exports analyses directly into custom PowerPoint decks using your corporate template. This unique feature means you can go from raw data to client-ready slides in minutes.
- Intuitive interface. PerfectSlide is AI native and built with AI from the beginning. The interface and whole workflow are very intuitive and easy to use. No training required.
Turn survey data into cross-tabs and client-ready slides with AI
Cross-Tabs – Slide Generation – Survey Text Analytics
2. Qualtrics – best for teams that need all-in-one platform
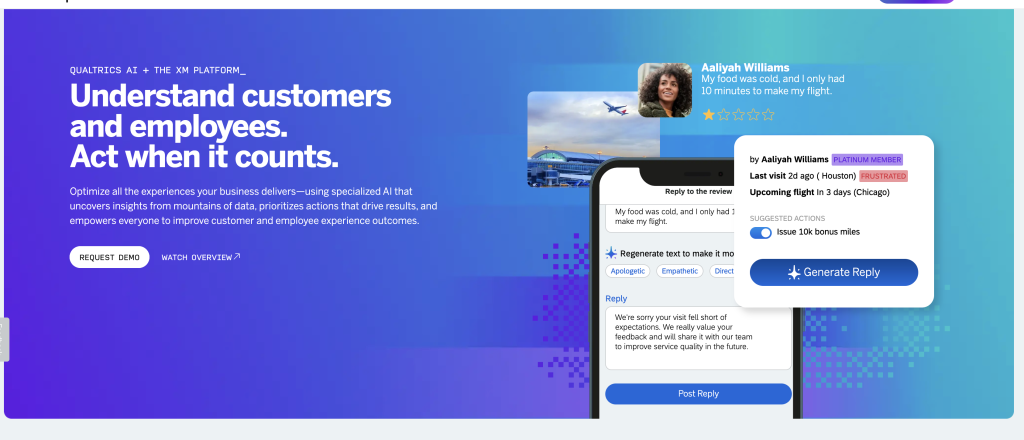
Best for: Organizations that need an all-in-one platform for both designing and analyzing surveys and sharing results via interactive dashboards.
Key features
- Crosstab tool. Qualtrics provides a cross-tabulation tool for multivariate analysis. Users can compare two or more variables, customize calculations (e.g., chi-squared or ANOVA) and create weighted tables.
- Text iQ. The Text iQ module uses natural language processing to assign topics to feedback, perform sentiment analysis and generate dynamic widgets for reporting.
- Dashboards and widgets. Qualtrics allows researchers to build customizable dashboards, combining charts, filters and AI-driven insights.
- Enterprise integrations and analytics. Qualtrics integrates with CRM, analytics and collaboration tools and offers advanced stats modules (Stats iQ, Predict iQ) for deeper analysis.
3. SurveyMonkey – best for survey creation with built-in AI analysis
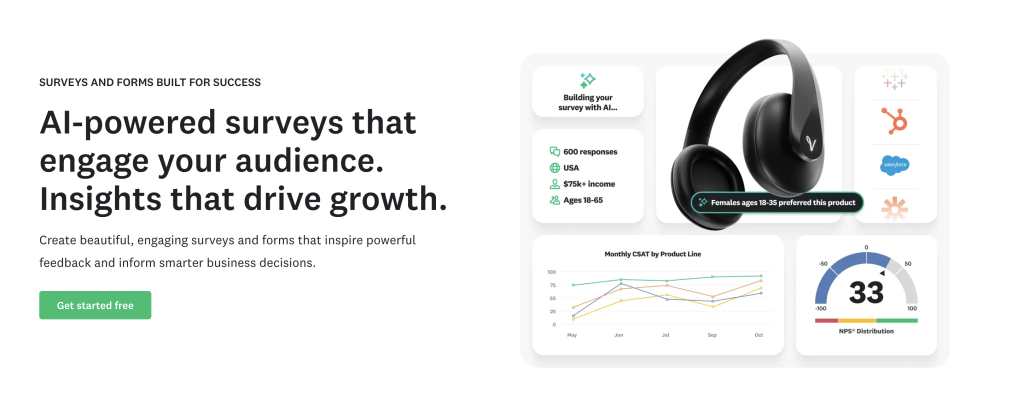
Best for: Teams that want user-friendly survey creation with built-in AI analysis.
Key features
- Built-in AI summaries: Quick insights on open-ends for faster readouts.
- Sentiment analysis at scale. The platform classifies open-text responses as positive, negative or neutral and lets users filter comments by sentiment for deeper insights.
- Customizable word clouds. SurveyMonkey lets analysts visualize text responses as word clouds and adjust colors, thresholds and categories. Users can highlight specific words, hide irrelevant terms and combine related words.
- Crosstab reports. Paid plans include crosstab reports that let you compare answers across questions and uncover relationships between categorical variables. Built-in statistical significance testing helps highlight meaningful differences.
- Ease of use. SurveyMonkey is known for its intuitive interface, templates and quick-start options, making it a good choice for teams without dedicated researchers.
4. Medallia – best for customer experience analysis
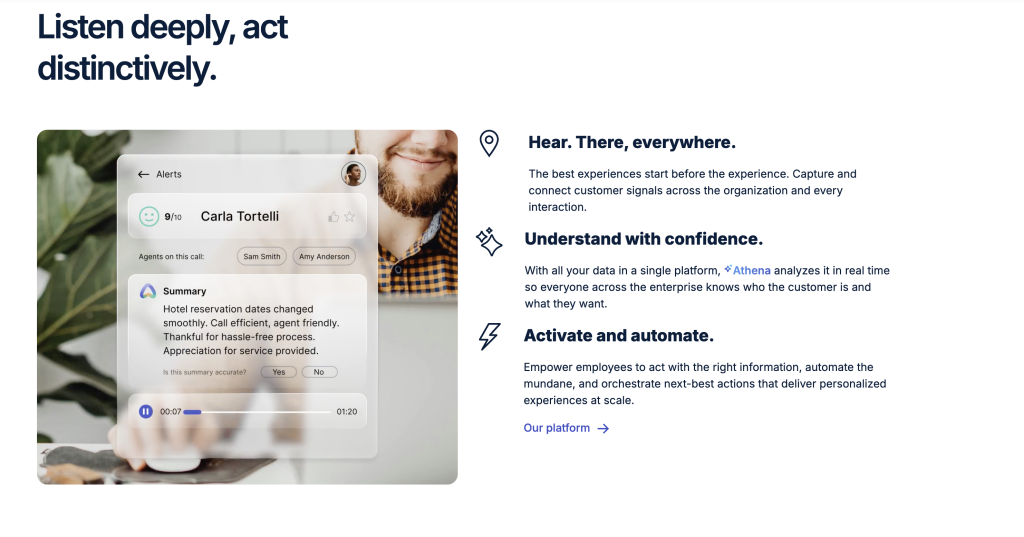
Best for: Customer experience leaders who want to capture and act on feedback in real time across multiple touchpoints.
Key features
- Experience Cloud + Text Analytics: Real-time ingestion from surveys, chats and reviews.
- Emotion & effort signals: Useful for CX programs with operational routing.
- Enterprise governance: Large-scale permissions and workflow automation.
5. Zonka Feedback – best for teams that need an all-in-one platform for collecting and analyzing feedback
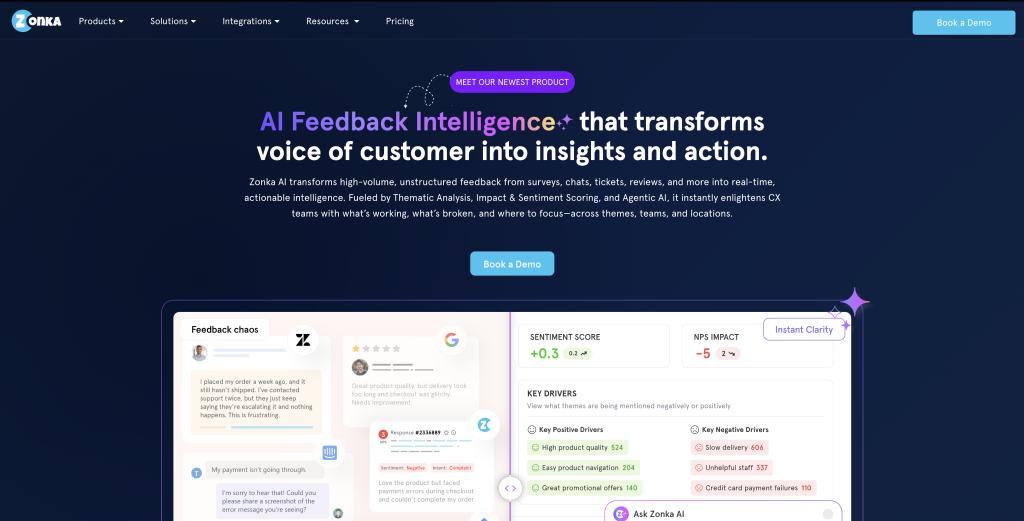
Best for: Teams that want an AI-powered Customer Feedback & Intelligence Platform to analyze open-ended survey responses at scale and uncover themes, sentiment and insights automatically.
Key features
- AI text analysis: Zonka Feedback applies AI-driven sentiment, emotion, intent and urgency detection to every open-ended response. It also identifies entities like staff, locations, products and services to provide deeper context.
- AI themes and tagging: The platform auto-detects themes and sub-themes from raw feedback and links them with NPS, CSAT, CES and sentiments, helping teams spot key drivers and emerging issues instantly. It also generates auto-tags for faster categorization.
- Insights and dashboards: Users get real-time dashboards, trends, leaderboards, and detailed question-wise insights. Feedback can be analyzed by locations, agents, pages, tags, and themes, with drill-down capabilities for context.
- Multi-channel survey support: Zonka Feedback supports survey collection across Email, SMS, WhatsApp, web widgets, in-app SDK, offline kiosks and more, making it easy to centralize all survey responses before running analysis.Feedback workflows: Teams can automate notifications, route responses based on conditions and run closed-loop workflows for detractors or urgent feedback, ensuring insights lead to action.
6. Tableau – best for visual storytelling and dashboards
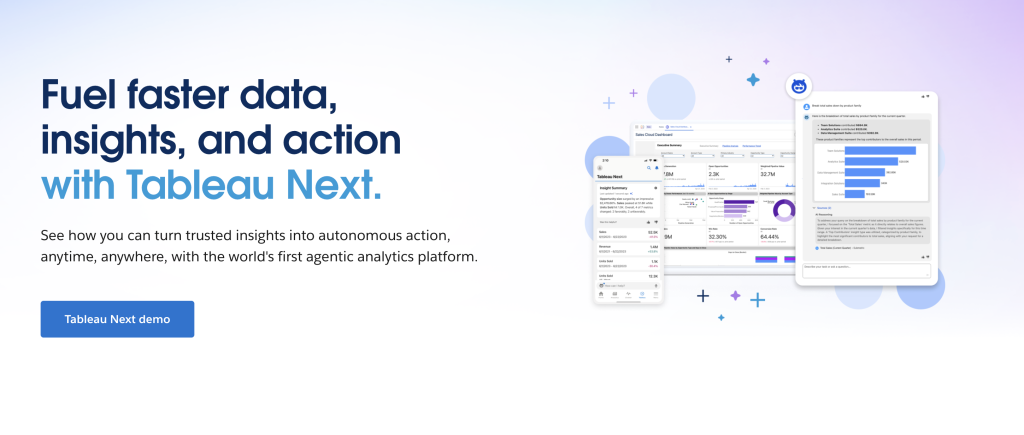
Best for: Insights teams focused on visual storytelling and interactive dashboards once survey data is structured.
Key features
- Exploratory visual analysis: Rapid slicing/dicing of survey KPIs and cross-tabs; great for stakeholder storytelling.
- Extensions & data science hooks: Python/R integrations for advanced stats and NLP outputs.
- Sharing: Interactive dashboards and server-based governance.
7. Microsoft Power BI – best for Microsoft-centric analytics
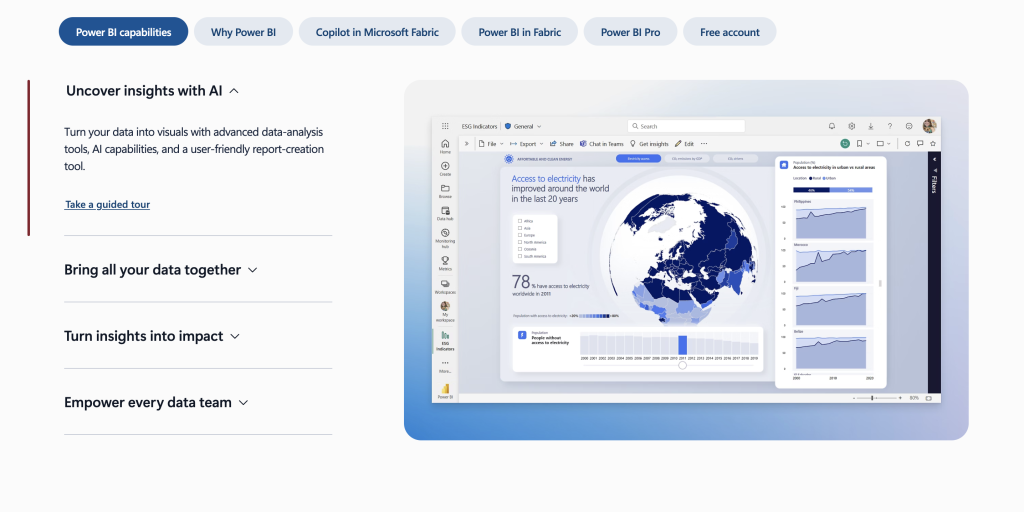
Best for: Analytics teams who need pixel-perfect dashboards and data models after exporting survey data.
Key features
- AI + Copilot assistance: Natural-language querying and quick summaries over your survey datasets.
- Connectivity & modeling: Join survey results with CRM, usage or revenue for richer context.
- Distribution at scale: Workspaces, app publishing and row-level security.
8. ChatGPT – best for brainstorming themes

Best for: Teams that want an AI assistant alongside their toolchain. Great for brainstorming themes, accelerating analyst workflows and generating drafts.
Key features
- Flexible open-ends assistance: Rapid summaries, theme suggestions and draft codebooks when guided by good prompts.
- Analyst co-pilot: Writes regex/SQL/Python for data prep, drafts survey readouts and explains statistical choices in plain language.
- Workflow glue: Can generate instructions, macros or scripts to connect your survey platform, BI and slide-production processes.
Quick Comparison Table
| Tool | Open-Ends AI | Cross-Tabs | PPT/Report Automation |
|---|---|---|---|
| PerfectSlide | Advanced (accurate themes, quotes, flexible exports) | High (auto-generation, apply weights) | Full (client-ready decks in minutes) |
| Qualtrics | Strong (Text iQ) | Strong (Stats iQ, dashboards) | Moderate (suite-native exports) |
| SurveyMonkey | Useful (quick AI summaries) | Moderate (core crosstabs) | Light (templates, basic exports) |
| Medallia | Strong (CX text analytics) | Program-level (operational cuts) | Moderate (CX reporting) |
| Zonka Feedback | Strong | Strong | Moderate |
| Microsoft Power BI | Limited (requires prompts/integrations) | Strong (modeling, DAX) | Minimal (export-driven, not deck-native) |
| Tableau | Add-on dependent (via integrations) | Strong (visual pivoting) | Minimal (dashboard-first) |
| ChatGPT | Useful (summaries, clustering with prompts) | Limited (no native engine; assist via scripts) | Light to Moderate (drafts/outlines; needs external PPT tooling) |
Leverage AI to create cross-tab tables and client-ready slides with PerfectSlide
If you are looking for an AI tool to automate the whole survey analysis process from building cross-tab tables to create powerpoint slides/reports, PerfectSlide will be the perfect choice. In one workspace, your team can code open-ended survey responses, bulk-create hundreds of cross-tab tables and generate client-ready PowerPoint slides. No copy-paste, no reformatting, no wasted hours.
Turn survey data into cross-tabs and client-ready slides with AI
Cross-Tabs – Slide Generation – Survey Text Analytics