


A round of focus groups doesn't end when the last participant logs off.
It ends with a folder of recordings.
Six sessions of 90 minutes each adds up to nine hours of conversation, with eight or so people per group talking, interrupting, and reacting to stimuli. Somewhere in there are the answers your client is paying for. Getting them out usually means:
- Hours of transcription and cleanup before analysis can even start
- Re-reading transcripts to work out who said what, and which segment they belong to
- Hunting for the quote you remember hearing in session three
- Cutting video clips by hand for the final readout
AI can take most of that work off your plate. Satrix Solutions, for example, used to deliver interview reports about five days after each interview. With BTInsights, their clients now get the report the same afternoon.
The catch is that accuracy depends on how the data is set up before the AI reads a single word.
Below, we'll walk through how to analyze focus group data with AI step by step, from the raw recording to the final showreel, using BTInsights as the example.
What Makes Focus Group Data Different
A focus group isn't six interviews that happen to share a room.
Participants react to each other. One comment sparks three more. A strong personality pulls the group toward their view, or a quieter participant nods along with something they don't actually agree with. The discussion also follows a guide, moving from warm-up questions through several concepts or stimuli.
That shapes how the data needs to be analyzed. For every finding, you'll want to know:
- Who said it, and what their profile is
- Which part of the discussion it came from
- How many participants shared the view, and whether anyone pushed back
- Whether the group was reacting to a dominant voice
Keep in mind that a general AI chatbot answers none of those questions well. Paste hours of transcripts into one and you'll typically get a fluent summary with no reliable link to who said what. That's why most of the steps below happen before the analysis itself.
The Focus Group Analysis Workflow at a Glance
Here's how each step compares when done by hand versus with BTInsights:
| Step | By hand | With BTInsights |
|---|---|---|
| 1. Transcribe | Hours of transcription and cleanup per session | Speaker-labeled transcripts in 50+ languages, with key terms added up front |
| 2. Prepare | Matching speakers to the screener by hand | Participant profiles replace speaker labels, plus chapters and PII removal |
| 3. Analyze | Reading and coding each session separately | Questions answered across the full study, by segment or chapter |
| 4. Find quotes | Searching transcripts and notes for remembered lines | Quote finder searches by meaning, with links to the transcript |
| 5. Build a grid | Filling in a spreadsheet question by question | Analysis grid with notes per participant and summaries per question |
| 6. Create showreels | Scrubbing and editing video manually | Clips from highlighted text, combined into a showreel |
| 7. Interpret | Researcher judgment | Researcher judgment, backed by linked evidence |
Step 1: Create an Accurate Transcript
Every finding, quote, and clip you produce later depends on the transcript.
A misheard word can flip a participant's meaning. A misattributed line can put an insight in the wrong segment. And once the transcript feeds the analysis, those errors are hard to spot.
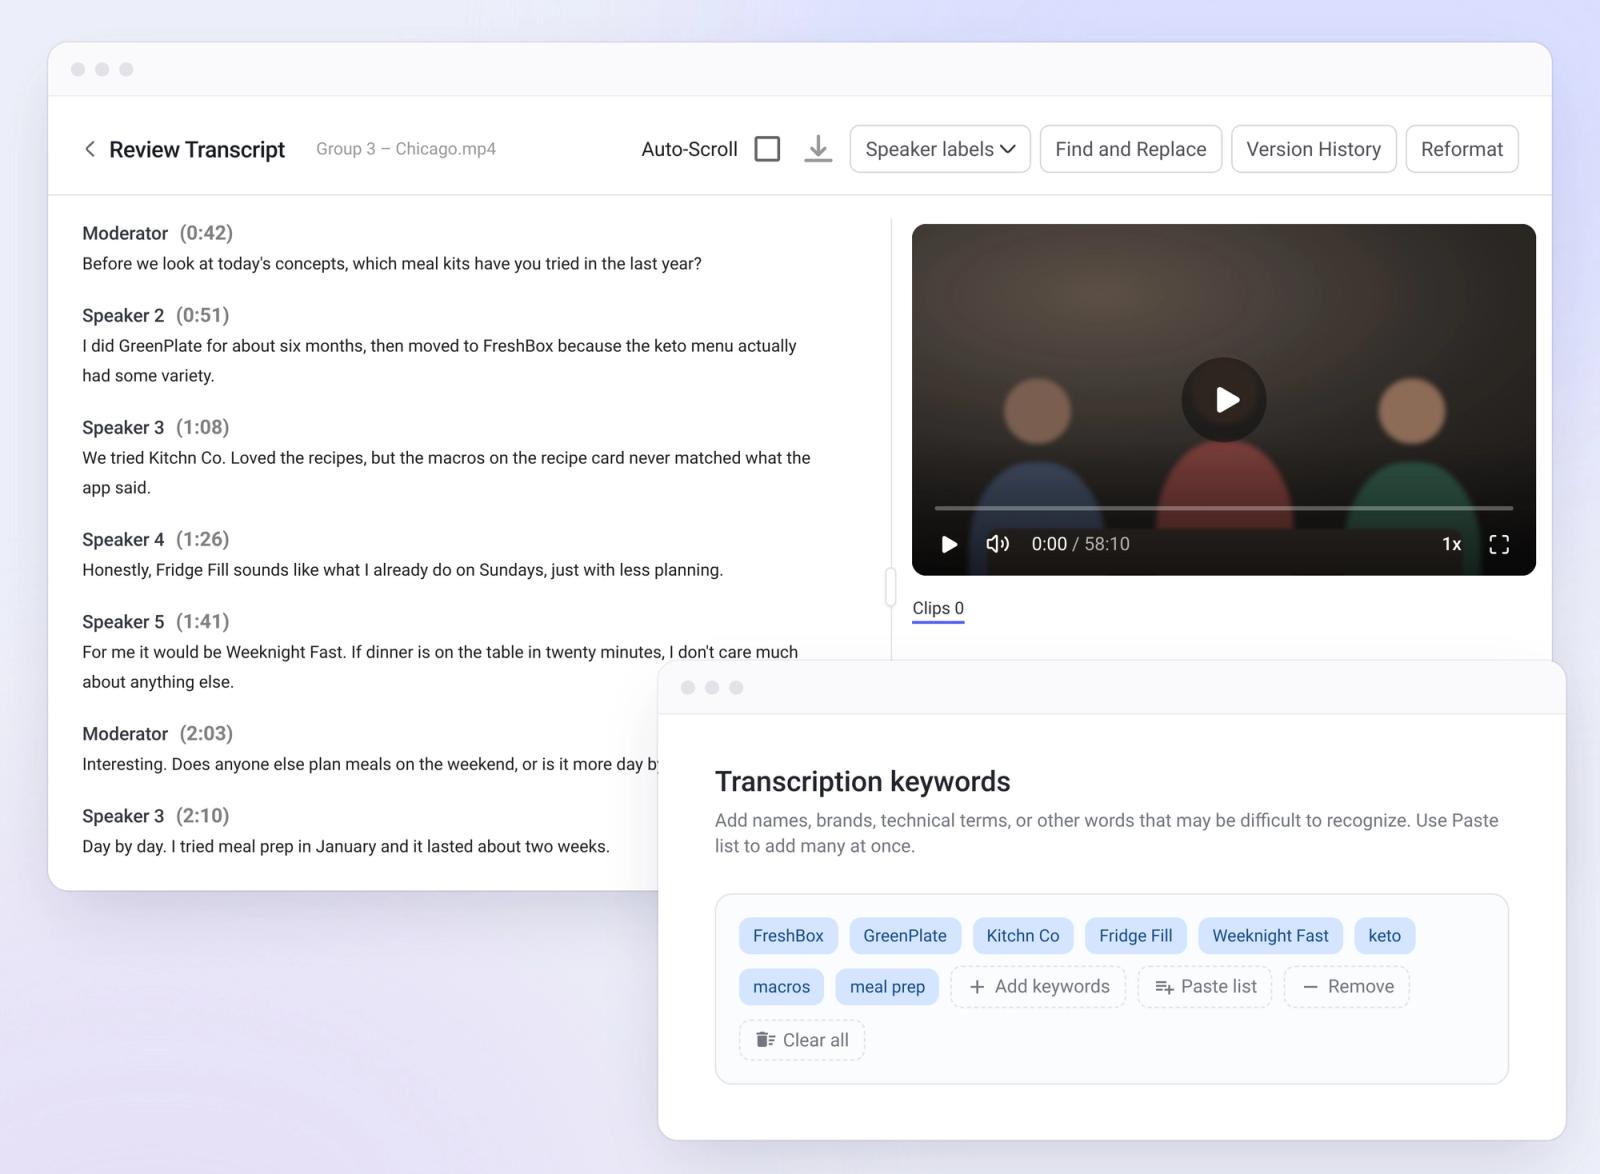
In BTInsights, you import your video or audio recordings and get transcripts back with speaker identification. Transcription works across 50+ languages, handles technical terms and difficult audio, and removes filler words and repetition so the transcript is clean enough to analyze.
Add key terms before you transcribe
Brand names, product names, competitor names, and category jargon are where transcription tools most often slip.
If your study covers a niche category, add those key terms before transcribing. For example, a pharma study might include drug names and clinical terms, while a CPG study might list every brand in the competitive set. The transcription then has the vocabulary it needs to get them right the first time.
Satrix Solutions, which runs customer and employee feedback programs for B2B companies, ran into exactly this problem. Their previous transcription tools struggled with industry terms, acronyms, and unusual company names, so staff had to correct and check every transcript before analysis could begin. After switching to BTInsights, that check generally needs one reviewer. As their COO put it:

“I regularly review transcription AI, and yours is the most accurate on the market, especially for people whose second language is English or who have strong accents.”
Step 2: Prepare the Transcripts for Analysis
This is the step that separates fast analysis from accurate analysis.
The idea is simple. Anything you already know about the study, such as who each participant is and how the discussion was structured, should be added to the data directly. Don't leave it for the AI to infer.
Replace generic speaker labels with participant profiles
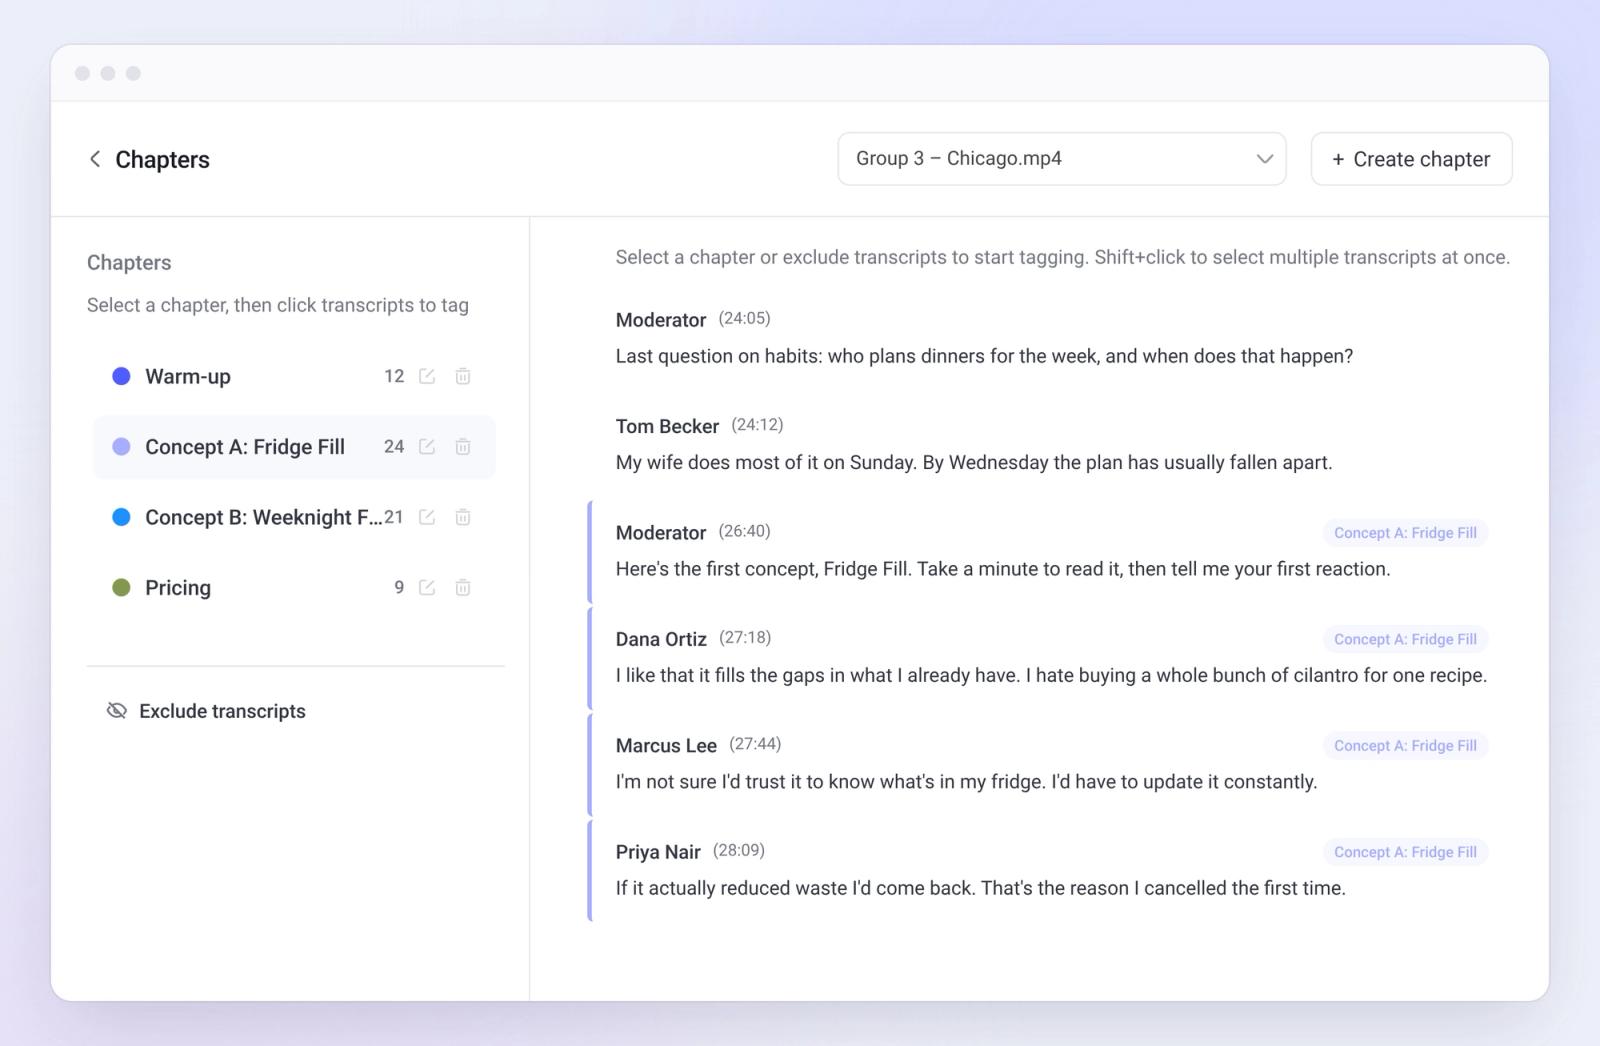
Transcripts start with labels like "Speaker 1" and "Speaker 2." Upload your participant profile (the screener or participant grid) to replace those labels with each participant's details, such as name, gender, age, or education.
That pays off twice. Every quote you pull later shows who said it at a glance. And you can run the analysis by demographics, since the AI is working from known profiles instead of guessing from the conversation.
Set up chapters for each part of the discussion guide
Most focus groups move through distinct sections: a warm-up, current habits, then concept A, concept B, maybe an ad test.
If you plan to analyze by section, set up those chapters now. Asking AI to work out where concept A ends and concept B begins during the analysis adds guesswork to every answer. Defining the chapters up front means each question runs against exactly the right part of each session.
Remove personal information
Participants sometimes mention names, employers, or other details that shouldn't travel into a client deliverable. Detect and remove that personal information before analysis, especially if transcripts or clips will be shared outside your team.
Step 3: Analyze the Transcripts With AI
With clean, labeled, structured transcripts, you can start asking questions.
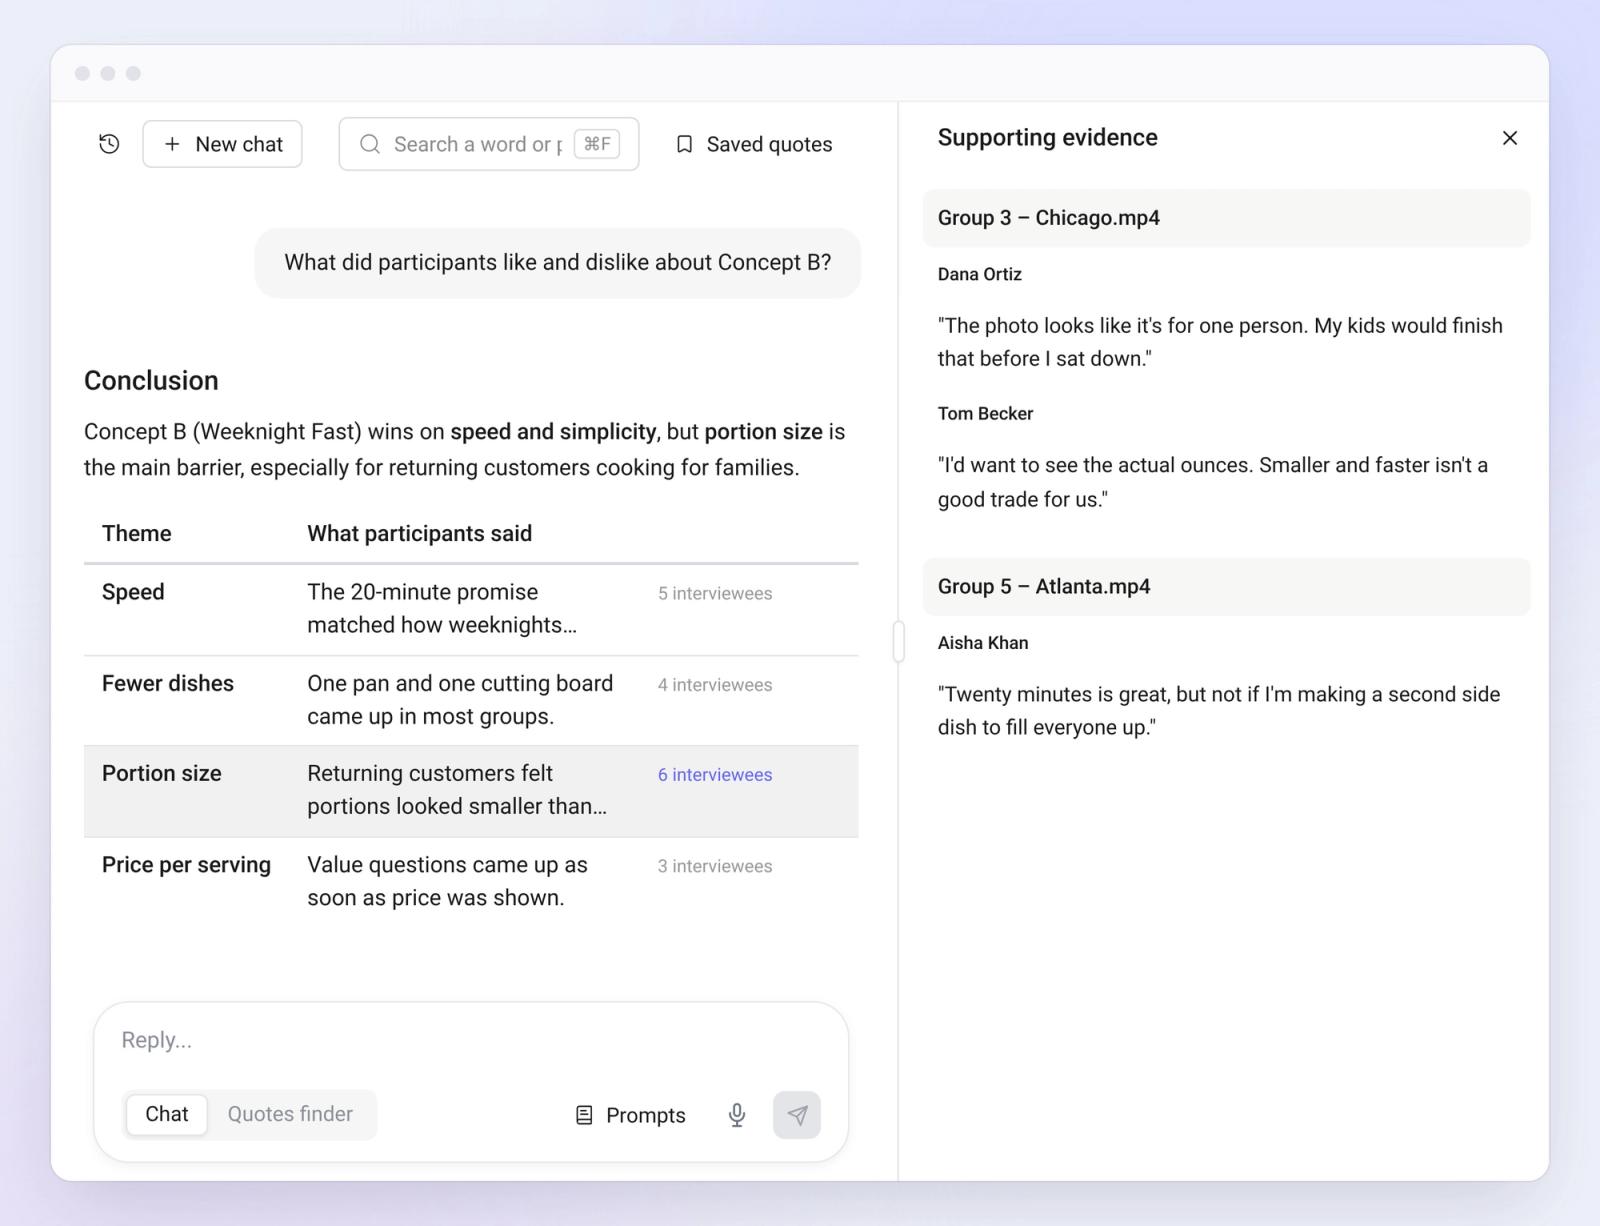
The BTInsights interview analysis agent works across every transcript in the study at once. Instead of reading session by session, you ask a question and get an answer drawn from all of them.
For example:
- What did participants like and dislike about concept B?
- What reasons did people give for switching brands?
- Which concerns came up in every group, and which only came up once?
Analyze by demographics, chapters, and segments
This is where the prep work from step 2 pays off.
Because participants carry their profiles and sessions are split into chapters, you can narrow any question. Compare how new and returning customers reacted to the pricing section. Look at what participants under 35 said about the packaging. Check whether reactions in one city differed from another.
Each of those comparisons would take hours by hand. Here, it's a follow-up question.
Check every insight against the source
Every insight the agent produces links to the supporting quotes, and every quote links back to the original transcript and recording.
That link is what makes AI focus group analysis trustworthy. You don't have to take a summary at face value. You can open the evidence, read the surrounding conversation, and confirm the finding holds up before it reaches a client.
Step 4: Find the Right Quotes
Quotes do the heavy lifting in a focus group report. They're also one of the most time-consuming things to collect.
The research agent's quote finder mode searches by meaning, not just keywords. Ask for every comment about onboarding frustrations, and you'll get the relevant quotes from across the study, including ones that never use the word "onboarding."
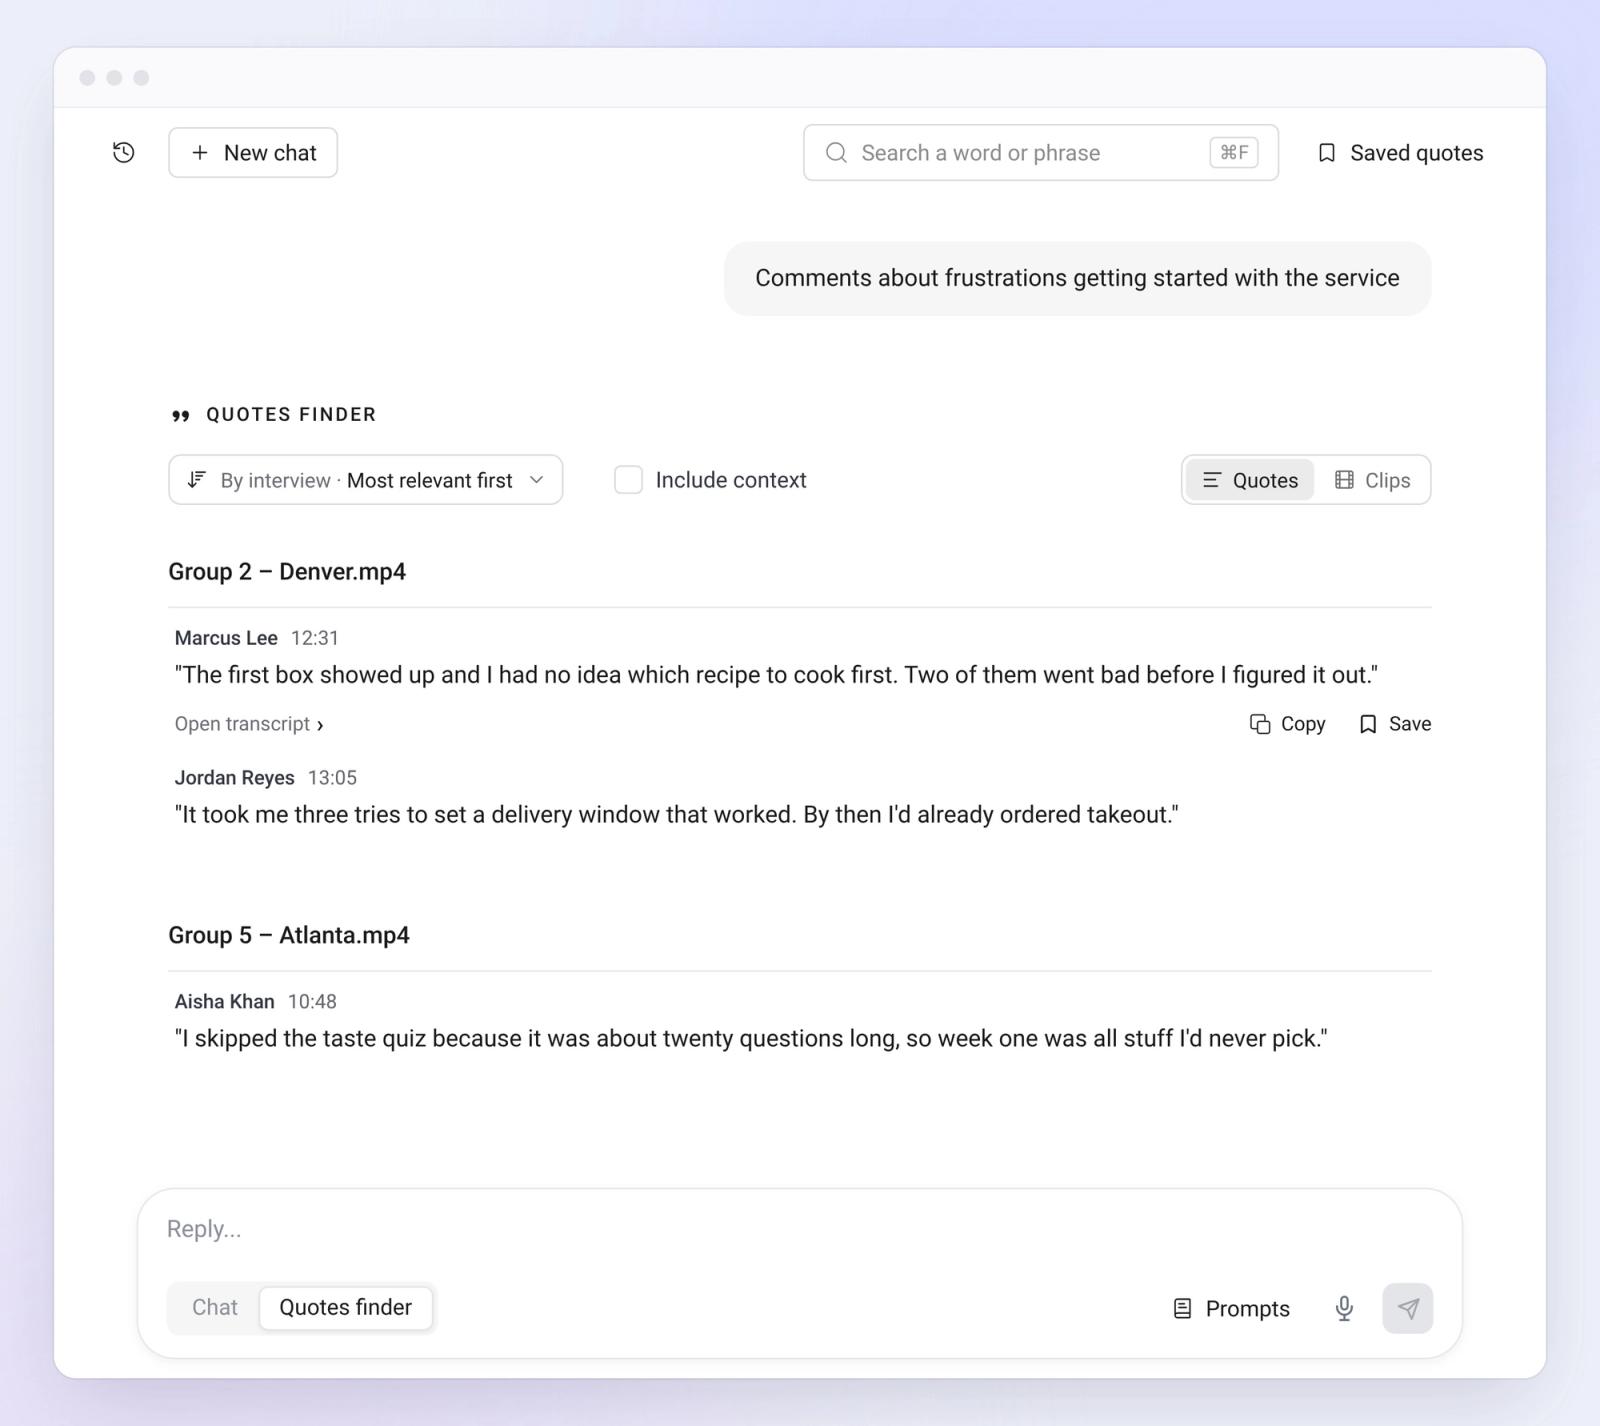
Each quote links to its place in the raw transcript. And because speaker labels now carry participant profiles, you can see right away whether a quote came from a first-time buyer or a long-time customer, which makes it much easier to choose quotes that represent the full group rather than the most talkative participant.
Step 5: Build an Analysis Grid
Plenty of teams still report question by question, following the discussion guide.
The analysis grid automates that format. It turns your discussion guide into a grid, generates notes for every participant on every question, and writes a summary for each question across all participants. Each note links back to the supporting transcript.
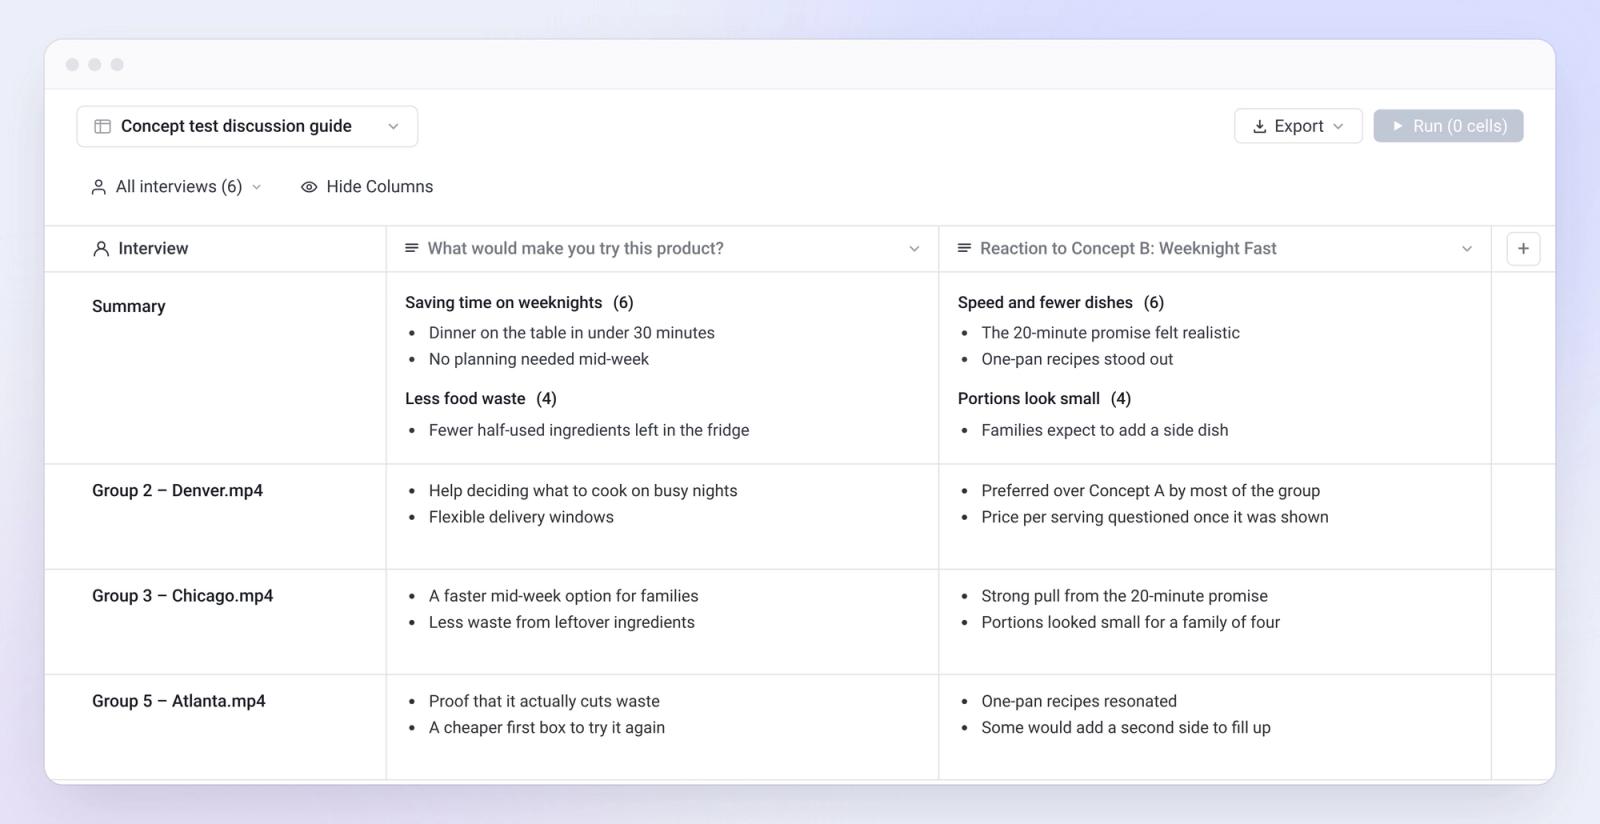
For example, a grid for a six-session study might show how each of 48 participants answered "What would make you try this product?" alongside a summary of the main reasons across the full group. That's the kind of table analysts used to build by hand in a spreadsheet over several days.
Having said that, the grid is a starting point for your report rather than the report itself. It gives you a structured, traceable first pass, so your time goes to interpretation.
If you need to quantify answers, such as how many participants preferred each concept, QuantTracker extracts structured values from every transcript and links each value to its source. You can learn more about the grid approach in our guide to analyzing in-depth interviews.
Step 6: Create Showreels
More and more clients want to hear findings in participants' own voices.
A two-minute showreel of real customers reacting to a concept often lands harder in a leadership meeting than a slide of bullet points. The trouble is that editing one by hand means scrubbing through hours of video.
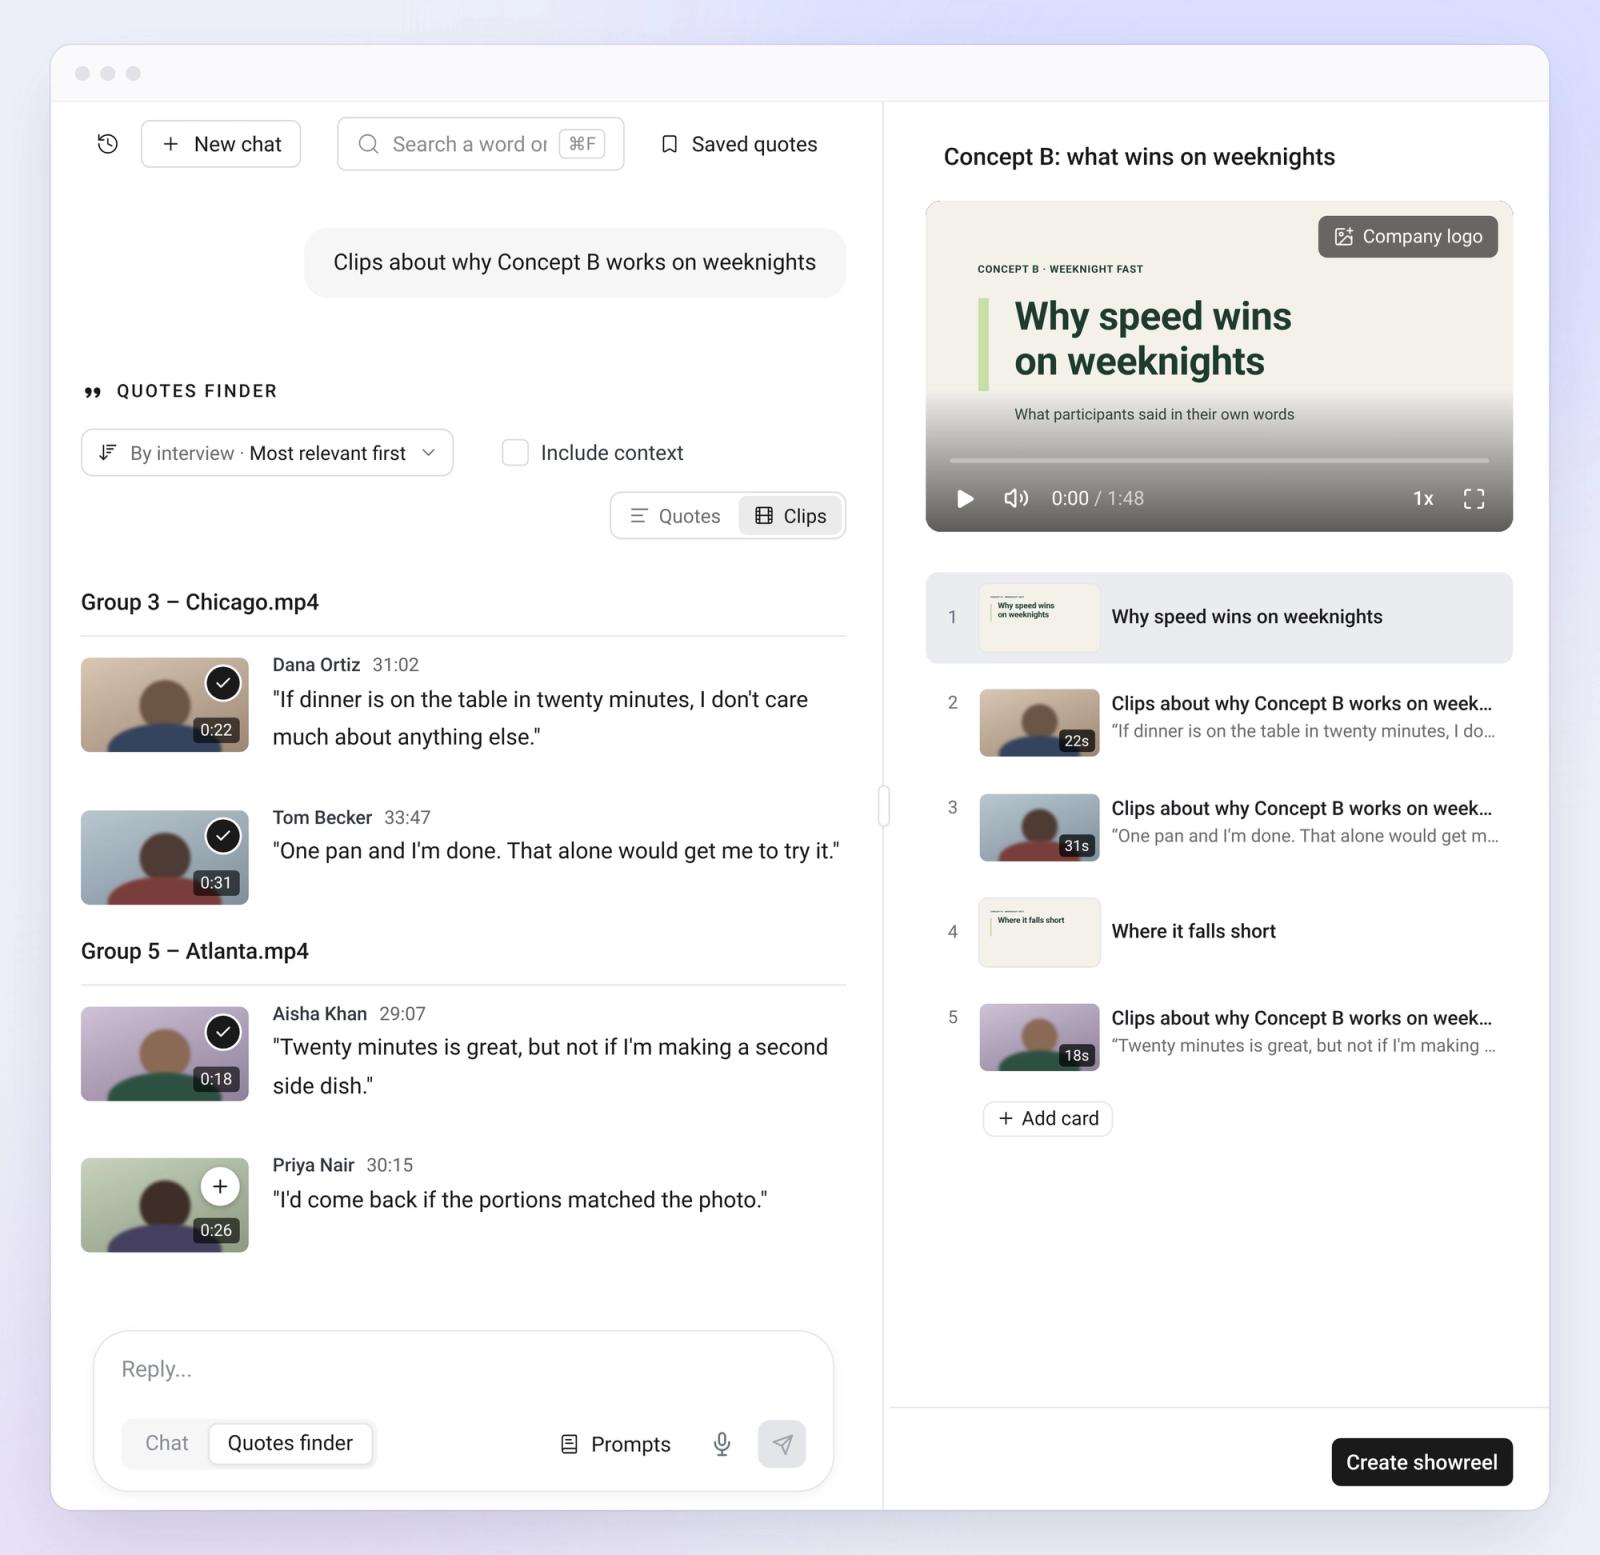
In BTInsights, you highlight any transcript text to create a video or audio clip. Then you combine clips into a showreel and add transition cards between them to introduce each theme. You can also ask the interview analysis agent to build a showreel for you, then review and edit it before sharing.
Candid Counsel, an opinion and messaging research firm, used BTInsights’ showreels tool to let clients hear participants explain their views and react to an ad or message in their own words.
The team starts with the story it wants to tell, then researchers pull quotes and timestamps from the transcripts, draft a script, and agree on the direction with the client, including how to introduce each section. Then they pull the clips, put them in order, and make any final adjustments. As founder John Cipriani puts it:

“Once we have alignment on the script, creating the final showreel couldn’t be simpler.”
Step 7: Interpret the Findings
AI can surface what participants said. Deciding what it means is still the researcher's job.
For example, the analysis might show that participants across all six groups got stuck on the same step of the sign-up flow. The insight your client needs is what to do about it: maybe the step needs to move later in the flow, or maybe the instructions need rewriting. That call depends on context only your team has.
This is also where focus group dynamics come back in. Before you report a finding as a group consensus, check whether it came from one dominant participant with others agreeing, or from several people raising it on their own. The linked quotes and transcripts make that easy to verify.
Finally, anchor each finding to the quotes and clips that support it. Evidence is what turns an interesting observation into a recommendation a client can act on.
Here's a quick guide to which tool fits which question during analysis and reporting:
| If you need to... | Use | Output |
|---|---|---|
| Answer a research question across the whole study | Interview analysis agent | Findings with linked supporting quotes |
| Compare groups, demographics, or concepts | Agent with participant profiles and chapters | Side-by-side findings by segment |
| Collect evidence for a theme | Quote finder | Relevant quotes with participant details |
| Report question by question | Analysis grid | Notes per participant and a summary per question |
| Quantify answers across participants | QuantTracker | Structured values linked to each transcript |
| Show findings in participants' own voices | Showreels | Shareable video built from transcript clips |
From Hours of Recordings to Findings You Can Show
Focus groups tell you why people think what they think. The hard part is getting that out of nine hours of recordings.
Transcripts need fixing. Speakers need matching to the screener. Quotes need hunting down, and clips need cutting by hand. By the time the real analysis starts, the deadline is already close.
BTInsights was built to fix that.
- Transcripts you can trust. Speaker-labeled transcription in 50+ languages, with key terms added up front.
- Analysis across the whole study. Ask questions by demographic, chapter, or group, with every insight linked to its source.
- Quotes and grids in minutes. Find evidence by meaning and generate notes for every participant on every question.
- Showreels in a few clicks. Turn highlighted transcript text into clips and combine them into a shareable video.
Book a demo to see BTInsights on your own focus groups. And if you're still comparing options, our roundup of the best AI focus group analysis tools covers the alternatives.