Open-ended responses are where the “why” lives. They are also where timelines slip.
If you have ever stared at 5,000 verbatims two days before a readout, you already know the tradeoff. You can code quickly and risk inconsistency, or you can code carefully and miss the moment.
In 2026, the best teams do not treat open-end analysis as a side task. They run it as a repeatable workflow: code reliably, validate quickly, quantify by segment, and export results straight into decision-ready deliverables.
This guide compares 10 tools that can help. It also gives you a practical way to choose based on the outputs you need, not vendor buzzwords.
What “good” looks like for open-ended analysis in 2026
A strong open-end workflow produces three things that stakeholders actually use.
First, a clear thematic structure. Themes should be understandable, mutually distinct enough to act on, and stable across waves.
Second, traceable evidence. Every theme needs supporting verbatims you can point to, not just a summary paragraph.
Third, quant outputs that hold up in a meeting. Counts and percentages by theme are the baseline, but most teams also need crosstabs by key segments like region, plan tier, tenure, NPS bucket, or customer type.
“Good” also includes the unglamorous part: review and governance. If you cannot easily audit and adjust coding, you will not trust the outputs enough to ship decisions.
How we evaluated tools
This list focuses on tools that support at least one of these needs: coding open-ended survey responses into themes, reviewing and editing codes, quantifying themes by segment, and turning outputs into reports or slides.
We did not prioritize tools that only generate summaries without a coding workflow. We also did not focus on general survey collection tools unless they have meaningful open-end analysis capabilities that tie into reporting.
When you evaluate options, use the same lens. Your job is not to find “the smartest AI.” Your job is to find the workflow that produces reliable, defensible insights on your timeline.
The shortlist criteria: 8 things to look for
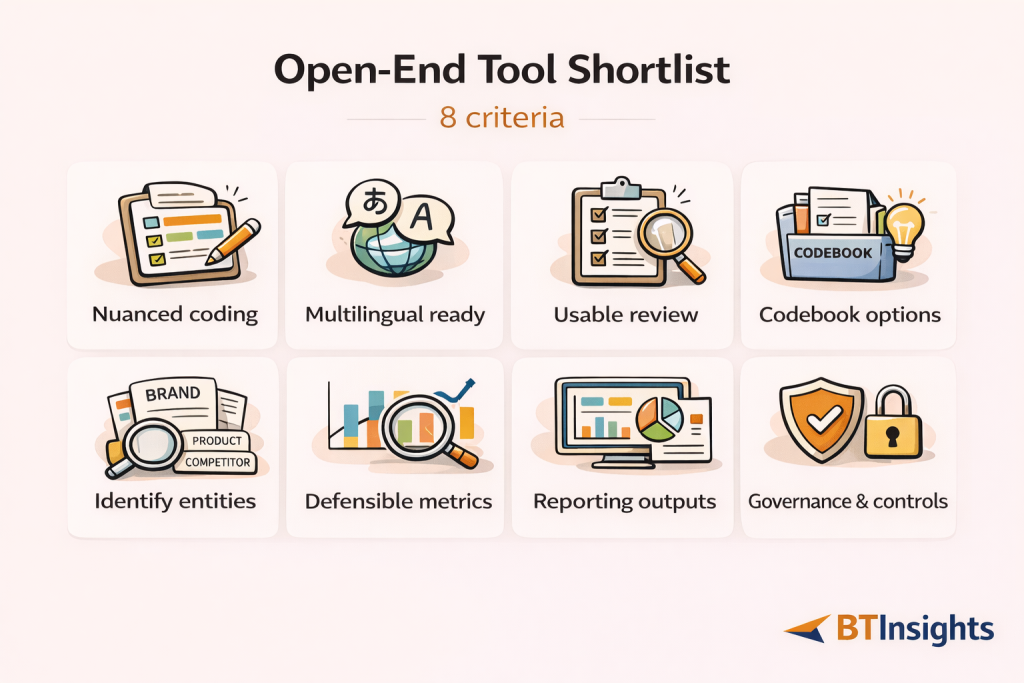
These criteria show up in every serious open-end workflow. If a tool looks impressive in a demo but fails on two or three of these, it will slow you down when the dataset gets real.
1) Coding quality for nuanced meaning
Open-ends are messy. A single response can include two drivers, one complaint, and a suggestion.
Good coding handles nuance like negation (“not bad”), mixed feedback (“love X, hate Y”), and subtle distinctions (“too expensive” vs “not worth it”).
In practice, reliability is less about perfection and more about consistency plus correction. You want outputs that are coherent enough to review quickly, and a workflow that makes it easy to fix edge cases.
2) Multilingual performance that is more than translation
Multilingual open-ends are not just an input problem. They are a comparability problem.
The bar is not “I can translate French to English.” The bar is “I can produce a stable theme structure across languages so my global results are comparable.”
If you run global trackers, this is often the deciding factor. A tool that is great in English but inconsistent across languages creates more work than it saves.
3) Human-in-the-loop review that is actually usable
Every team needs a review layer. Even the best automated coding still benefits from quick QA.
Look for workflows that let you scan responses by theme, reassign codes in bulk, merge or split themes, and adjust labels without breaking everything downstream.
If review is slow, your team will skip it. If your team skips it, your stakeholders will eventually notice.
4) Codebook flexibility: AI-generated, your own, or both
Some projects start with exploration. Others require a fixed codebook for tracking.
The best tools support both modes. You should be able to let the system propose a starting codebook, and you should be able to bring your own code definitions when consistency matters.
Also check whether the tool can handle hierarchical codebooks. Many real studies need parent themes and subthemes.
5) Entity coding for brand, product, and “what did you use” questions
A lot of open-ended questions are not “experience” questions. They are entity questions.
Examples include “Which brands did you consider?” “Which tool are you using today?” or “Which competitor did you switch from?”
Entity coding requires extraction, normalization (for spelling variants), and deduping. If a tool cannot do this well, you end up cleaning lists manually, which is surprisingly time-consuming.
6) Quant outputs you can segment and defend
A theme list is not enough for most B2B teams. You need to quantify.
At minimum, you want theme frequency, percentage, and the ability to compare segments. You also want to avoid fragile results where small segment sizes create noisy conclusions.
A useful tool helps you build and export tables that look like the rest of your quant work.
7) Reporting and deliverables: charts, tables, and PPT-ready exports
Most insights teams spend more time packaging results than analyzing them.
If your workflow ends with “copy chart into slides” and “paste quotes into a doc,” your bottleneck is now reporting.
Look for charting, export options, and a clean path to PowerPoint. If you run a tracker, that “last mile” is where weeks disappear over a year.
8) Governance and practicality
For many teams, adoption fails on practicalities. Permissions, sharing, auditability, and data handling matter.
If you are in a regulated environment, you will also need to check procurement requirements and data retention settings. It is better to discover constraints early than after your pilot goes well.
Quick decision guide: which tool type fits your workflow
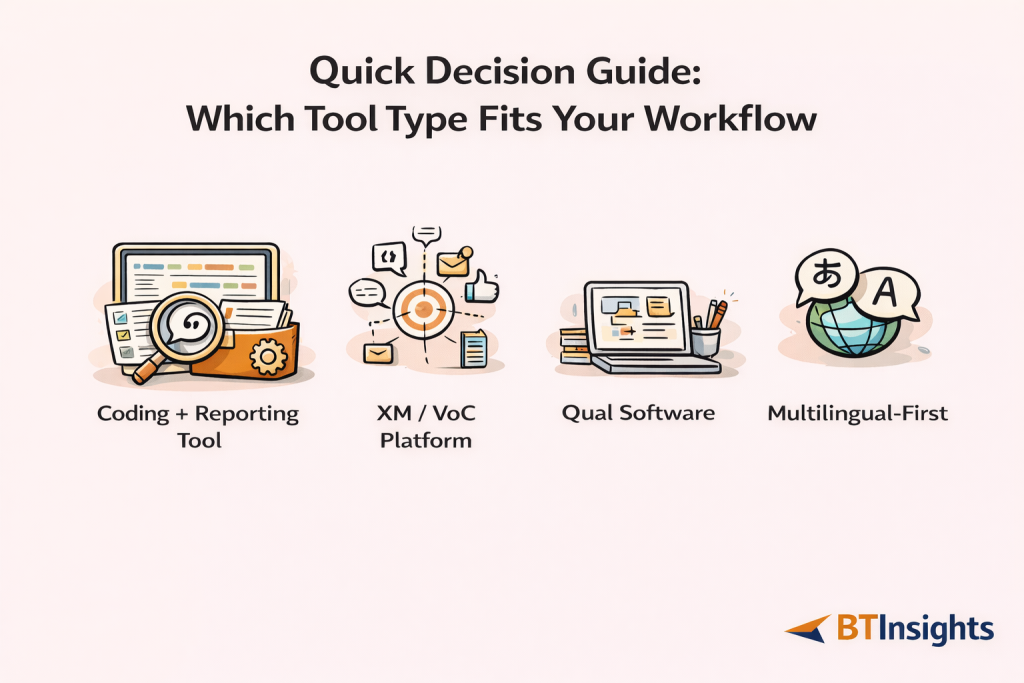
If you mostly need “research-grade open-end coding plus reporting,” choose a tool designed around coding, review, and quant outputs. This is common for market research teams and tracking programs.
If you are an enterprise VoC program combining surveys with omnichannel feedback, you may benefit from a broader experience management platform. You will likely trade simplicity for governance and integration.
If you are doing deep qualitative work across multiple datasets and want maximum manual control, qualitative analysis software can be a fit. You will likely trade speed and slide automation for method depth.
If you are global and multilingual, prioritize multilingual consistency and review workflows first. Everything else is secondary, because multilingual failure will force manual work no matter how good the charts look.
AI survey open-ends analysis with exceptional accuracy
Let AI generate codes or use your own codebook
The 10 best tools for analyzing open-ended survey responses in 2026
These tools solve the problem in different ways. The right choice depends on whether your “output” is a codebook and slide deck, or a dashboard and operational workflow, or a qualitative research repository.
1) BTInsights: Best overall for market research teams
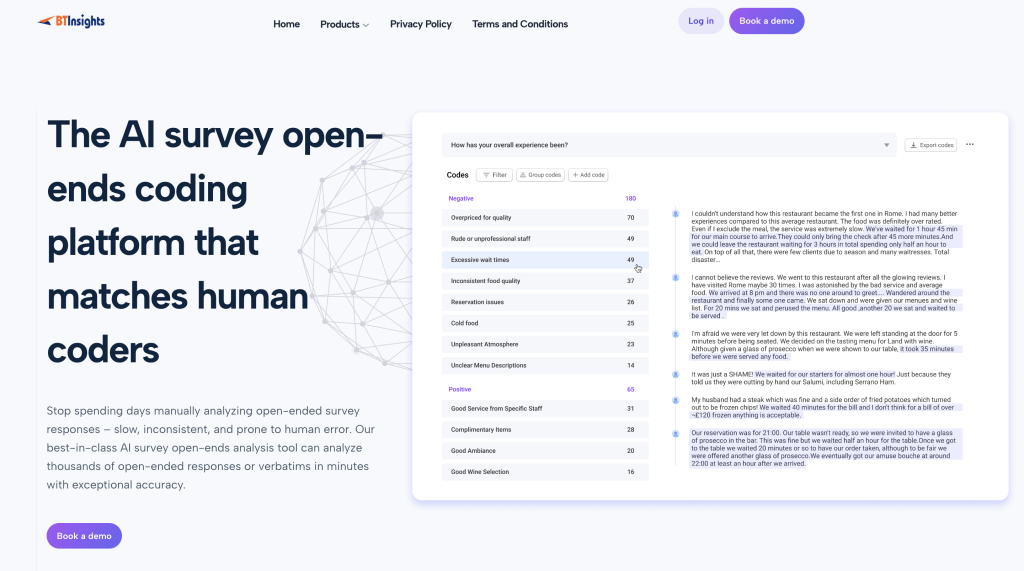
BTInsights is the best fit when your open-ended workflow needs to move fast but still hold up to scrutiny. It is built for research teams that need consistent coding at scale, including multilingual datasets, and that want to stay in control of the final output through simple review and editing.
It also supports different coding modes, so you can explore with AI-generated themes or lock in a tracking codebook, plus handle entity-style questions (brands, products, tools) where clean extraction matters.
- Works well for: high-volume trackers, NPS verbatims, product feedback, brand tracking, multi-country studies
- Why teams pick it: nuanced coding, 50+ languages, strong human-in-the-loop review, flexible codebook options, entity coding
- Reporting fit: charts + export to PowerPoint in your preferred format, plus code-based crosstabs to quantify drivers by segment
- Choose it if: your work ends in a deck and decisions, and you need speed without losing reviewability and defensibility
2) Ascribe
Ascribe is often considered when teams want a well-known, dedicated option for open-ended coding. It tends to appeal to research teams that need structured theme outputs connected back to survey data, especially when they want a tool that is recognized in the “open-end analysis” category rather than a general survey platform feature.
- Works well for: teams that want a familiar, established name for open-ended coding
- What to validate: how smoothly the review workflow fits your process, how codebooks handle tracking vs exploration, and how easy it is to get segment-ready outputs
- Reporting fit: look for export options for theme distributions, supporting verbatims, and any segment comparisons you need for readouts
- Choose it if: you want a dedicated open-end solution and value using a widely recognized category player
3) Qualtrics: Text iQ and related text analytics
Qualtrics is most compelling when your organization is already standardized on Qualtrics and you want open-end analysis inside the same ecosystem. The key advantage is tight linkage between verbatims and the rest of your survey data, which can make segmentation and dashboarding easier for enterprise reporting needs.
The tradeoff is that complexity and configuration can be heavier than research teams want for fast, repeatable coding-to-deck workflows.
- Works well for: enterprise teams already running surveys and reporting in Qualtrics
- Strength to leverage: native connection to survey variables for segmentation and dashboards
- What to validate: codebook control, review/edit usability, and whether you can get PPT-ready outputs without rebuilding
- Choose it if: keeping everything in one system matters more than lightweight speed
4) Medallia
Medallia is typically chosen when open-ended responses are part of a broader VoC program, not a standalone research deliverable. It can be a strong fit when the goal is operationalization: routing feedback into actions, tracking follow-through, and managing governance across a large organization.
If your main output is a research-style story with themes, crosstabs, and quotes in slides, confirm the workflow supports that without extra manual work.
- Works well for: enterprise VoC and CX programs combining survey verbatims with other feedback sources
- Strength to leverage: governance and operational feedback loops
- What to validate: researcher-friendly review/editing, quote traceability for reporting, and segment comparisons for insight storytelling
- Choose it if: you need operationalization and enterprise governance as much as analysis
5) SurveyMonkey (text analysis capabilities)
SurveyMonkey is a practical choice for smaller teams that want quick, lightweight insights from open-ends without building a complex workflow. It’s often “good enough” when you need early signal, basic grouping, and simple sharing.
Where teams hit limits is when they need research-grade coding control, repeatable codebooks, deeper validation, or reporting outputs that match stakeholder expectations.
- Works well for: fast-turn surveys, small-to-mid datasets, lightweight reporting needs
- Strength to leverage: speed of setup and accessibility
- What to validate: depth of coding workflow, ability to handle custom codebooks, and whether segment-level tables and deck-ready charts are easy
- Choose it if: simplicity is the priority and your reporting requirements are modest
6) Alchemer (and related analytics capabilities)
Alchemer is often selected for flexibility. Teams that need custom survey flows, integrations, or operational wiring may prefer it over more rigid platforms. For open-ended analysis, the key question is how much is truly supported out of the box versus what requires configuration or add-ons, and whether the workflow is practical for coding, review, and exporting deliverables.
- Works well for: teams that value configurability and integrations in survey operations
- Strength to leverage: flexible survey setup and connectivity
- What to validate: the real “day-to-day” coding workflow, review/edit speed, and how much reporting is done inside vs outside
- Choose it if: your survey infrastructure needs are complex and the open-end features match your scale
7) QuestionPro (text analytics and research stack)
QuestionPro is appealing when you want a more consolidated research environment: survey creation, data handling, and reporting in one place. This can reduce tool sprawl and simplify handoffs. For open-ended analysis, it is worth stress-testing whether the coding workflow meets research-grade expectations, especially around codebook control, reviewer edits, and code-based crosstabs that mirror quant standards.
- Works well for: teams that want an integrated research stack and fewer tools
- Strength to leverage: unified workflow for survey + reporting
- What to validate: codebook flexibility, reviewer edits, and strength of quant outputs (especially crosstabs built from codes)
- Choose it if: you want consolidation and the open-end workflow fits how your team reports
8) Thematic
Thematic is commonly evaluated when teams want automated theme discovery and structured outputs from feedback text. It can be useful when your goal is to quickly identify what people are talking about and quantify those themes.
As with any theme-first tool, the decision tends to hinge on workflow control: multilingual consistency, tracking codebook stability, entity-style questions, and how easily outputs move into stakeholder-ready deliverables.
- Works well for: teams prioritizing theme discovery and fast structuring of verbatims
- Strength to leverage: turning large volumes of text into themes you can quantify
- What to validate: multilingual handling, ability to enforce tracking codebooks, and support for entity extraction and normalization
- Choose it if: theme discovery is the core need and you have a clear validation and reporting workflow
9) NVivo
NVivo is a classic choice for teams that value qualitative rigor and manual control. It shines when you are doing deep qualitative work, using more formal coding approaches, and combining multiple sources like interviews, focus groups, and open-ended survey responses.
The tradeoff is speed and packaging. If your work frequently requires fast turnarounds, segmentation, and PowerPoint-ready outputs, NVivo can feel heavy unless you invest in a very structured internal process.
- Works well for: qualitative researchers who want granular control and method depth
- Strength to leverage: robust qualitative coding and analysis features
- What to validate: how you will quantify and segment coded themes for survey reporting, and how you will turn outputs into decks efficiently
- Choose it if: qualitative rigor and manual control matter more than rapid survey-to-slide workflows
10) MAXQDA
MAXQDA is another strong option for mixed-methods and qualitative-heavy teams that want robust manual coding capabilities. It can work well when open-ended survey data is part of a broader qualitative project, especially if your team prefers hands-on control over automation.
Similar to NVivo, the key tradeoff is the “last mile”: how quickly you can move from coded text to crosstabs, charts, and stakeholder-ready slides.
- Works well for: mixed-methods projects and qualitative teams doing detailed coding
- Strength to leverage: strong qualitative workflow features
- What to validate: effort required to produce scalable survey reporting outputs (crosstabs, charts, PPT-ready deliverables)
- Choose it if: you want qualitative rigor and can manage more manual reporting work
How to validate open-ended coding results before you report
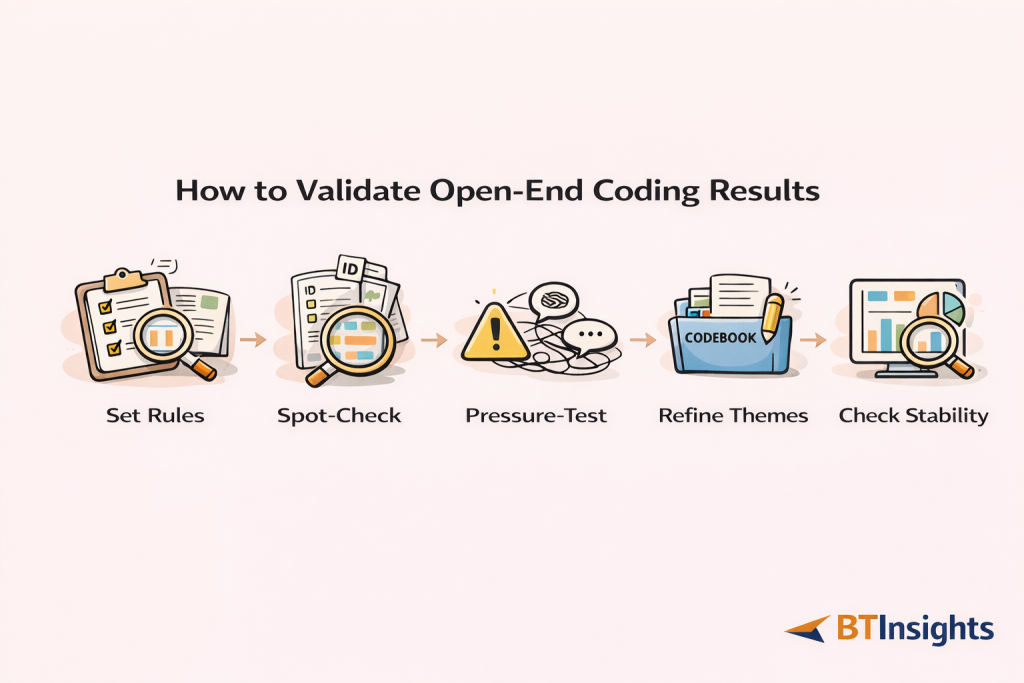
Validation is the difference between “interesting themes” and “defensible insights.”
Even when coding is automated, you should treat validation as a standard step. It can be fast if your workflow supports review and edits.
A practical approach looks like this.
Step 1: Define rules for multi-topic responses. Decide whether you allow multiple codes per response and how you handle “two drivers” answers.
Step 2: Run a stratified spot-check. Sample across key segments, and if you are multilingual, sample across languages. Review the top themes first because they will drive decisions.
Step 3: Pressure-test edge cases. Look specifically for negation, sarcasm, mixed sentiment, short or vague answers, and slang. These are where coding often drifts.
Step 4: Refine theme definitions, not just assignments. If reviewers keep changing the same boundary, update the codebook definition so the rule is explicit.
Step 5: Check stability after edits. Make sure your top themes and segment comparisons do not swing dramatically after review. If they do, tighten definitions and increase review on that subset.
This approach keeps validation lightweight but meaningful. It also makes your report easier to defend because you can explain how you ensured reliability.
What to include in your report or slide deck
Stakeholders rarely want “all the themes.” They want the story, the evidence, and the action.
A clean open-end reporting structure usually includes the following.
Start with a theme leaderboard that shows the top themes with counts and percentages. Keep labels plain and readable.
Then show the segment differences that matter. This is often a crosstab view, for example themes by plan tier or themes by NPS bucket. Pull two to four highlights, not twenty.
Add representative quotes for each key theme. Choose quotes that are specific and decision-relevant, not just emotional.
If you have trend data, show what changed since last wave and what likely drove it. Tie changes to specific themes, not only overall sentiment.
Close with actions. Translate themes into decisions, owners, and what you will measure next.
Tools that export charts and tables into PowerPoint reduce the last-mile workload. Over a year of tracking, that time savings is often bigger than the analysis savings.
Common pitfalls when choosing tools
The most common mistake is buying a “summarizer” when you need a coding workflow. Summaries can sound plausible but still be hard to quantify and validate.
Another common issue is underestimating multilingual complexity. If your global themes are not comparable, your global story will not hold up.
Teams also skip validation when they are busy. That is understandable, but it increases the chance that a stakeholder finds a mismatch in the verbatims and loses trust.
Finally, many teams optimize for dashboards when their real deliverable is a slide deck. Choose based on what you actually ship.
FAQ
What is the best way to analyze open-ended survey responses?
The best approach is a repeatable workflow: create or confirm a codebook, code responses into themes, validate with a structured review, quantify themes by segment, then report with quotes and clear actions.
How do you code open-ended responses reliably?
Reliability comes from consistent definitions and review. Use clear code definitions, allow multi-code assignment when needed, spot-check across segments and languages, and refine boundaries that repeatedly cause disagreement.
Do I need a predefined codebook?
Not always. Exploratory studies often start with AI-assisted or analyst-created themes that evolve during review. Tracking studies typically benefit from a predefined codebook so results remain comparable over time.
How do I analyze open-ended responses in multiple languages?
Avoid relying on translation alone. Look for tools and workflows that support multilingual coding, then validate by sampling across languages to ensure themes mean the same thing in each context.
What is entity coding and when do I need it?
Entity coding extracts named items like brands, products, or tools from responses. You need it for questions like “Which brands do you use?” where the output should be a clean, deduped list rather than abstract themes.
How do I turn coded open-ends into crosstabs and charts?
Once responses are coded, you can treat codes like categorical variables. Build counts and percentages by code, then cross-tab them against segments like region or NPS. Use charts that are easy to interpret and include quotes to keep results grounded.
Can these tools replace human review?
In practice, the best results come from combining automation with review. Automated coding can speed up theme creation and assignment, while human-in-the-loop workflows help you validate nuance, correct edge cases, and produce defensible outputs.
AI survey open-ends analysis with exceptional accuracy
Let AI generate codes or use your own codebook