Introduction: Mining the Hidden Gold of Open-Ended Questions
Quantitative data has its place in market research. After all, it’s how we know what. But qualitative data is where we find out why. Open-ended survey questions are where the real qualitative gold is found, offering insight into raw customer feedback, detailed opinions and honest suggestions, and those occasional serendipitous gems that closed-ended questions can’t touch. Yet for many researchers, open-ended questions are a “nice to have” or overlooked altogether. The truth is that it’s time-consuming, yes—but more importantly, it requires a thoughtful approach. Organizing open-ended verbatims into something you can take action on is called coding, and it can turn the subjective noise of thousands of customers’ individual thoughts into a well-organized symphony of objective data that can shape key business decisions.
If you’ve ever thought to yourself “I wish I knew how to code open-ended questions better,” then this guide is for you. We’ll cover the important concepts, break out the strategic differences, and, most importantly, give you a detailed framework you can use to turn your customers’ verbatims into your organization’s most valuable source of intelligence.
The Importance of Open-Ended Questions
Closed-ended questions are great for creating metrics that can be measured and tracked over time. However, when it comes to understanding, that is, getting rich context, open-ended questions are indispensable. By giving respondents an opportunity to answer in their own words and on their own terms, open-ended questions help put you in the respondent’s shoes, as Qualtrics puts it. In many cases, these unprompted responses will bring unexpected pain points, new ideas, and the story behind the customer’s behavior to light. In short, they reveal unknown unknowns and can help researchers understand and spot emerging trends which traditional survey questions can’t, as Pew Research Center notes.
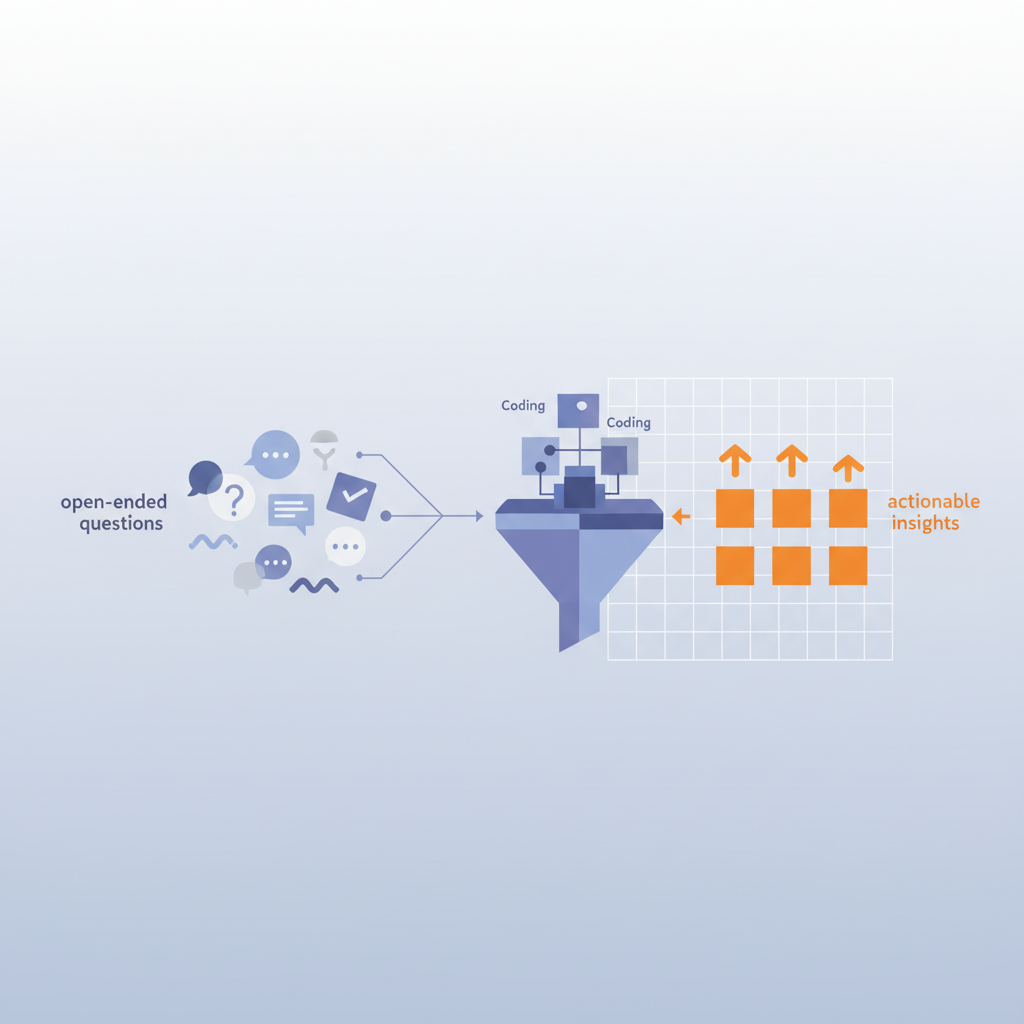
The Problem: Unstructured Data
The main issue with open-ended responses is that they are unstructured data. A survey with thousands of respondents can produce an enormous amount of qualitative data with each user submitting a unique answer. Without a system in place to organize that feedback, analyzing it can be a daunting, time-consuming and subjective process that lacks the power to identify patterns, quantify themes or come to meaningful conclusions. The aim is to go from a sea of individual comments to an organized dataset you can trust and use to inform your strategy, products and services, and customer experience improvements. Coding is the bridge that makes that possible.
Key Terms and Definitions: A Quick Refresher on Coding Basics
Before we get into the actual nuts and bolts of a coding process, it’s worth taking a minute to step back and make sure we have a solid understanding of the concepts at play. While at a technical level, it is about labeling data, it’s just as important to appreciate the big picture, as to the exact “how to” of the task. Coding is a structured process of interpretation. But it’s also a marriage of science and humanism. It takes effort to navigate.
What is Survey Coding? Defining Verbatim Coding
Survey coding, also known as verbatim coding, is the process of going through open-ended responses and assigning a label (or category) based on what the comment is about. Simple example: “The checkout process was confusing and too slow.” Categories might be “Poor User Experience” and “Checkout Issues.”
That is how you can take those thousands of scattered verbatims and meaningfully organize them into data points you can actually compare and analyze. Coding is the process of systematically identifying, naming, classifying, and tabulating qualitative data. And it is a key step in answering the “why” or “how” and “what now” with open-ended survey questions.
Building Blocks: Categories, Themes, and the Codebook
The coding process revolves around three key components:
- Categories (or Codes): The specific label applied to individual comments. Codes should be fine-grained (only represent one idea). Example codes are “Slow Shipping,” “Helpful Customer Service,” and “High Price.”
- Themes: Interpreted, higher-level categories that are based on a collection of associated categories. Categories of “Slow Shipping,” “Damaged Product,” and “Lost Package” might be placed under a high-level theme of “Logistics & Fulfillment Problems.”
- Codebook: This is the rulebook of coding. It’s the building block from which your whole coding system is based. This is the document where you will outline every category you have and give an explicit definition for each and examples of in/out of scope verbatims. Creating a good codebook is the first and most important step of the coding process, and is especially important if you are manually coding with a team. The codebook is the basis of consistency.
The Bridge from Qualitative to Quantitative Data
Once each and every response is coded with all applicable categories, the coded data can now be sorted, aggregated, and presented as quantitative data. Count each category to know how many respondents mentioned a particular topic. Drill down to the category level or themes to know which are the most prevalent among your customer set. Cross-tab qualitative results against demographics (“Do men complain more about the checkout process?”) or behavioral data (“Has volume of negative customer sentiment changed since our new pricing went into effect?”) The goal is a measurable body of data that can be cleanly put in a presentation.
Strategic Decision-Making: Manual, Automated, or Hybrid Coding?
One of the first (and most important) decisions that you will need to make is your coding approach. This could be manual coding, automated, or a hybrid approach of both. The decision on which direction to go will often come down to several variables including: the size of the dataset, project deadline, budget, and the desired level of nuance.
Factors to Consider When Choosing a Coding Approach
- Volume of Data: How many open-ended responses do you have to code? Hundreds, Thousands, or 10,000s?
- Time & Resources: What is your deadline and budget? Do you have a team for manual work?
- Complexity of Data: Are the responses mostly straightforward? Or is there sarcasm, industry jargon, multiple ideas in one sentence?
- Required Granularity: Do you need a general high-level understanding of themes? Or do you need a more nuanced, in-depth, granular level of understanding?
AI survey open-ends analysis with exceptional accuracy
Let AI generate codes or use your own codebook
Try a Hybrid Approach to Get Speed with Accuracy
Most market research projects will benefit from using a hybrid approach which typically involves doing an initial automation pass to get the bulk of the work done, and then letting a human do the more nuanced part of the work. A researcher would then go through the more ambiguous or complex responses that the machine flagged, double-check and refine the machine-generated categories, and validate the results. This approach offers the best of both AI and human efficiency, along with nuanced interpretation that only a human can provide.
Mastering Manual Coding: Precision and Deep Understanding
Step-by-Step: Your Manual Coding Playbook
- Familiarization: Take the time to read (ideally 10-20%) of the open-ended responses. This helps acclimate you to the wording, tone, and range of topics the respondents bring up in their answers.
- Initial Code Development: As you read, start making note of the initial categories that arise from the data. This is the first step of the inductive coding process and the seed of your initial code list.
- Codebook Creation: This involves transforming your list into a formal codebook. Write a clear and concise definition for each category. Also include inclusion/exclusion criteria. This will be the single source of truth for coding.
- Systematic Coding: Work through each and every response one by one. Apply one or more codes from the codebook to each response. It’s okay (and expected) to add new codes as new concepts arise. Just be sure to update the codebook!
- Review and Refine: Do at least one check-in with your work. Are you consistently applying codes in the same way? It’s very common to combine/split/rename categories as you get a better understanding of the data.
Advanced Codebook Design: Handling Complexity and Evolving Data
A simple list of codes won’t work when dealing with open-ended survey responses. A more sophisticated codebook may include a hierarchical structure (Parent/Child codes, e.g. Parent: “Product Feature”, Child: “UI/UX”, “Performance”, “New Feature Request”). It will also have rules for deciding whether to split responses that mention multiple topics, allowing you to assign multiple codes to a response to fully understand what’s being said.
Common Challenges and Best Practices in Manual Survey Coding
- Coder Drift: It’s very human for a coder’s understanding of a category to slowly shift over time. Combat this by checking in regularly and always referring back to the codebook.
- Inter-Coder Reliability: In cases where multiple coders are involved, ensure that everyone is applying the codes in the same way. Have two coders independently code a subset of the data, then measure their agreement rate.
- Ambiguity: It’s very common for an answer to be ambiguous or otherwise unclear. Create a specific category that is used to code “Uncodable/Unclear” responses.
Unleashing Efficiency: Automated Coding with Text Analytics and AI
Coders cannot read volumes and volumes of survey data. It’s simply not a feasible solution when you get thousands of respondents every time you poll your customers. This is where automated coding using text analytics and AI changes the game.
The Rise of AI-Powered Text Analysis
The state-of-the-art in AI and Natural Language Processing (NLP) now make text analytics powerful and easy to use. The tools have gotten to the point where they can read text, understand context, and detect sentiment with amazing accuracy.
They can also churn through tens of thousands of open-ended responses in mere minutes, where it would take a human team of 4-5 people days to do the same analysis.
How Automated Coding Works with the BTInsights Survey Coding Platform
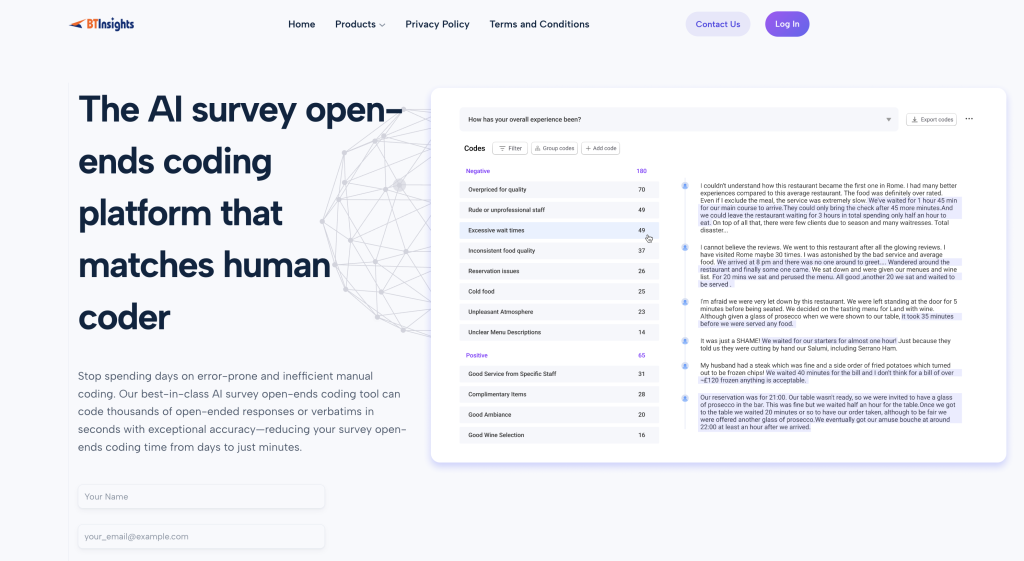
BTInsights is the most accurate survey open-ends analysis platform. It can code thousands of open-ended survey or text responses in minutes with high accuracy and consistency.
Below are the key steps.
- Data Ingestion: Upload your raw survey data to the platform.
- Text Pre-processing: If your responses include a mix of different languages, you can use the “Translation” functionality to automatically detect and translate all the non-English responses into English. You can also transcribe your video responses into transcripts before the coding them.
- Theme & Topic Detection: The BTInsights platform allow you to choose different coding methods suitable for different types of questions. For example, some questions might be more suitable for extracting qualitative themes while others might be more suitable for just extracting a list of unique entity names. And also, for some projects, you may prefer to assign one response to multiple codes while for other projects, you might prefer to assign one response to only one code.
- Sentiment Analysis: Each response and theme will be assigned assigned a sentiment (positive, negative, neutral).
- Data Export: The platform will display the list of codes, code descriptions and frequencies. You can click on each code to display all the relevant survey responses. You can also export the coding results into different formats such as Excel or SPSS.
Choosing the Right AI Survey Open-Ends Coding Tools
When it comes to picking a text analytics tool, you’ll need to consider ease-of-use, customization flexibility, accuracy of sentiment analysis, and how well it integrates with your survey platforms. Some solutions are deliberately kept simple for fast and easy thematic analysis, while others allow for building complex NLP categorization models that the machine trains over time.
Beyond Coding: Making Data-Driven Decisions and Recommendations
Remember, the end game is not to end up with a sanitized dataset. It’s to use the coded insights to take business action. So the final part of the process is putting everything together and telling a story that will compel the business to act.
Summarizing Findings and Drawing Insights from Coded Data
Once the coding’s done and the data’s quantified, it’s time to do the analysis. Look for the most common themes in the data. Is there a marked difference in feedback between customer segments? Did a recent new feature introduction trigger a surge in a particular feedback category? The aim is to start to see the bigger picture that the data is painting beyond the individual pieces of data.
Spotting Actionable Insights in Feedback
Some pieces of feedback have a greater capacity to drive decision-making than others. The most actionable feedback is usually specific, recurring, and related to a vital part of the customer journey. For example, if the keyword “shipping costs are too high” is emerging as a theme, and 30% of a key demographic says it in their feedback, that’s a data-backed, specific problem that a business can immediately act on. These nuggets of actionable insights are what can really influence business decisions.
Writing Up Actionable Recommendations
The hallmark of a good research report is actionable recommendations. For each key insight, suggest a specific, measurable business action. If the data suggests confusion around a new feature, for example, you might recommend “Create a series of in-app tutorials and a dedicated FAQ page to help customers understand new features, with the aim of reducing related support tickets by 25%.”
Coded open-ended data can be actioned across the business, including in:
Use Cases for Actioning Coded Open-Ended Data
- Product Development: Pinpoint top-requested features and common pain points to help guide the product roadmap.
- Marketing: Gain a sense of the language that customers use when talking about the brand, and use it to inform messaging.
- Customer Support: Identify recurring issues so you can update training materials and improve your self-service pages.
- UX/UI Design: Dig down into more detailed usability issues on a particular website or app.
Conclusion
Open-ended data coding is the workhorse of 21st century market research. It’s the rigorous discipline that turns the authentic voice of the customer into a finely tuned, actionable strategic asset. It’s time to move beyond the quick and dirty surface analysis and really start to understand what’s behind your customers’ needs, frustrations and desires.
Manual, automation or hybrid – these open-ended data coding techniques will help you to listen, understand and do something about what you’re hearing. The true value of a survey isn’t in the questions that you ask – it’s in the decisions that you make based on the answers you get. Use the proven techniques from this guide to ensure that the valuable feedback that your respondents are giving you is really being used to make informed decisions, create customer-focused innovation and drive business success.
AI survey open-ends analysis with exceptional accuracy
Let AI generate codes or use your own codebook