Market research sounds simple: pick a method, gather data, make a decision. In practice, most teams struggle less with “what method is this?” and more with “which method will answer our question fast enough and reliably enough to act on?”
The best approach is to start with the decision you need to make, then select the method that gives you the evidence you need. Market research is fundamentally about using information to reduce risk and make better choices, not collecting data for its own sake.
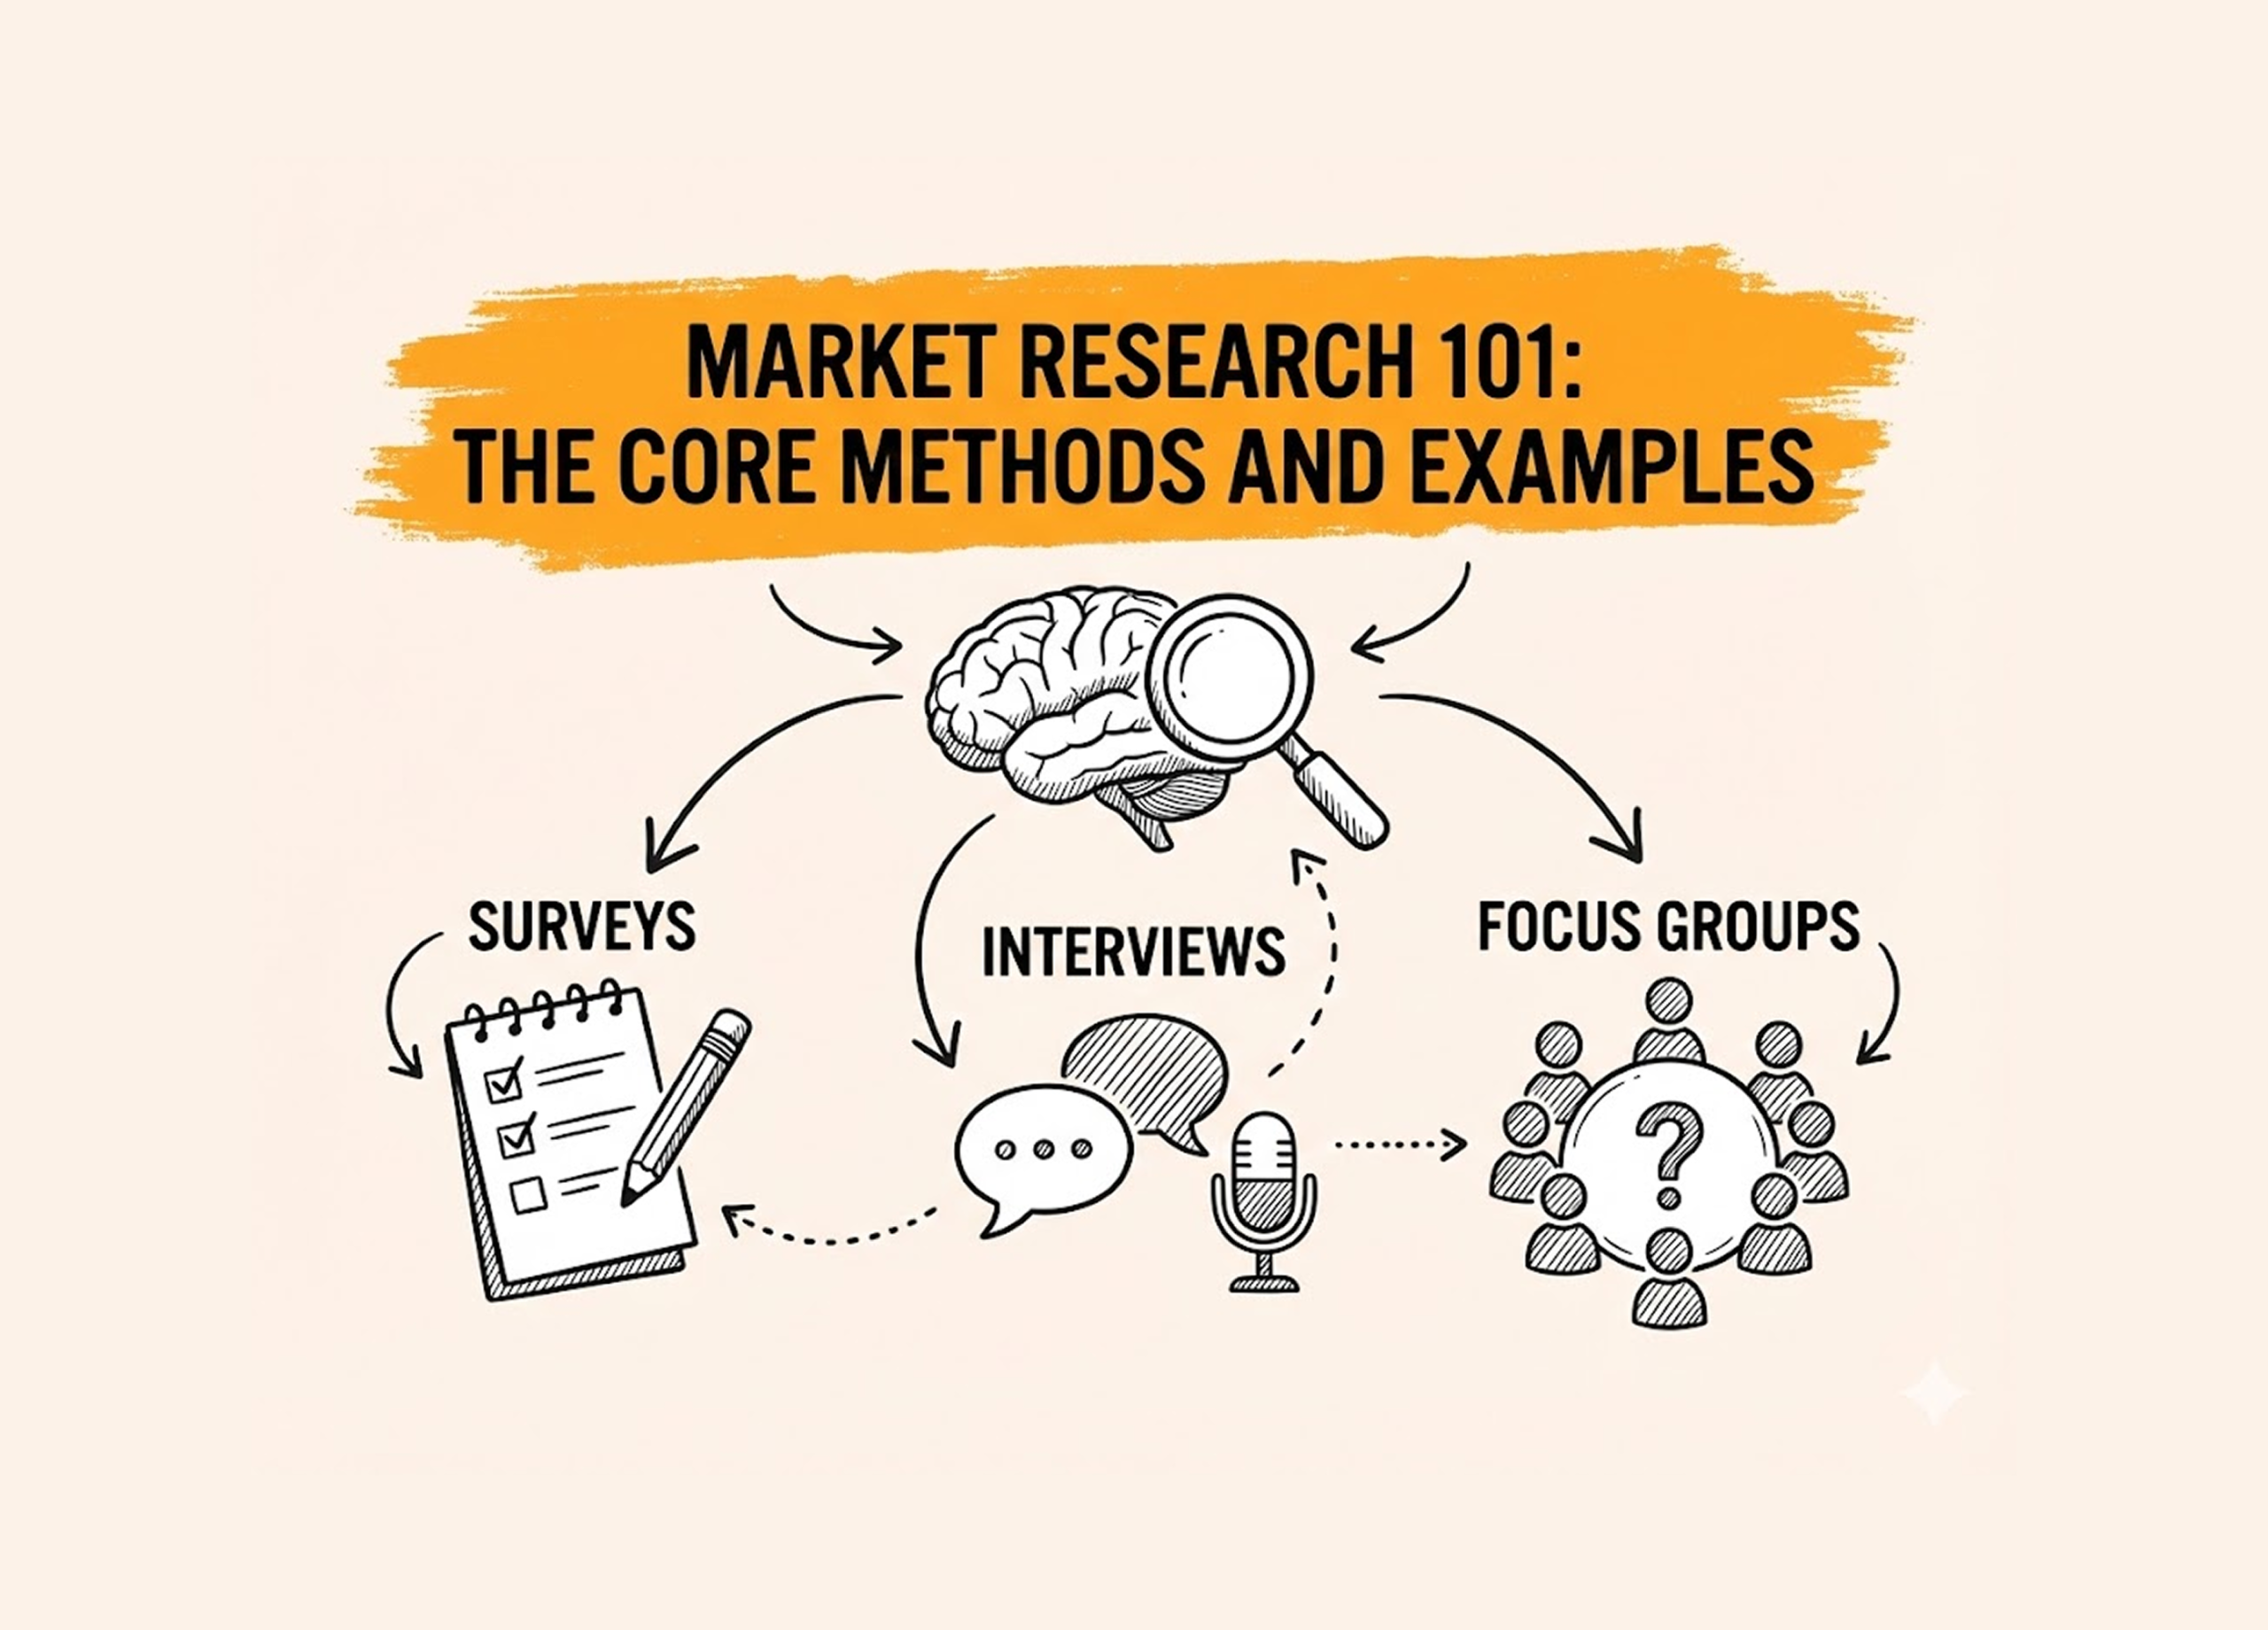
This guide breaks down the core market research methods, shows what each method is best for, and explains how to turn results into outputs people can use and trust.
Market Research 101: what it is (and what it is not)
Market research is a structured way to understand people’s needs, preferences, behaviors, and context so you can make better decisions. It can involve qualitative methods (like interviews) and quantitative methods (like surveys), along with secondary research (existing sources).
Market research is not the same as:
- Product analytics alone (analytics shows what happened; research helps explain why and what to do next).
- A single survey with no plan for analysis or action.
- A deck full of charts without a clear decision and recommendation.
The difference is the workflow: a clear question, an appropriate method, disciplined analysis, and an output designed to support a decision.
The core market research methods
1) Secondary research (desk research)
Secondary research uses existing information: industry reports, public datasets, competitor websites, review sites, earnings calls, and internal sources like support tickets or sales notes. It is typically the fastest way to build context and avoid asking questions that have already been answered elsewhere.
When to use it:
Use secondary research when you need to size the landscape, understand category language, identify competitor positioning, or form hypotheses before running primary research.
Example:
A B2B SaaS team considering expansion into a regulated vertical starts with desk research to map the ecosystem, terminology, key constraints, and major competitors. That desk work sharpens the primary research questions from “What do you need?” to “Which compliance workflows break down today, and where do you lose time?”
How to make it decision-ready:
Summarize what’s known, what’s assumed, and what remains uncertain. Then turn gaps into research questions.
2) Surveys (quantitative and mixed)
Surveys are best for measuring how common something is, comparing segments, and measuring patterns. Surveys can be fully quantitative (ratings, rankings, multiple choice) or mixed with open-ended questions that add detail.
When to use it:
Use surveys when you need to answer “how many,” “how often,” “which is most important,” or “how do groups differ?” They are especially useful for prioritization, concept testing, pricing signals, and tracking changes over time.
Example:
You want to decide which onboarding improvements will reduce early churn risk. A survey can quantify which friction points are most common and how those vary by customer segment, plan tier, or use case.
What makes surveys hard:
Analysis is often the bottleneck. Even if the closed-ended results are straightforward, the open-ended responses can be the most valuable and most time-consuming part.
If your survey has a lot of open-ended responses, plan for analysis upfront: you’ll need a way to code responses into themes, review and refine the codebook, and then turn results into outputs like crosstabs and slide-ready summaries. BTInsights’ survey verbatim coding platform is a popular tool among market researchers to speed up the analysis while keeping it reviewable, with themes linked to supporting quotes so findings can be checked before reporting.
For close-ended survey questions, market researchers are starting to use AI tools such as PerfectSlide to quickly create cross-tab tables and generate client-ready slides. Leveraging AI tools dramatically reduces the analysis time for quantitative survey data from days or weeks to just hours.
Turn survey data into cross-tabs and client-ready slides with AI
Cross-Tabs – Slide Generation – Survey Text Analytics
3) In-depth interviews (qualitative)
In-depth interviews are one-to-one conversations designed to uncover motivations, decision criteria, language, and context. They are best for exploring “why,” discovering unmet needs, and understanding complex workflows.
When to use it:
Use interviews when the problem is ambiguous, when you need to map decision journeys, or when stakeholders disagree on what’s really happening. Interviews are also ideal early in a product cycle, before you know what to measure in a survey.
Example:
A team sees lower conversion in a specific industry segment. Interviews reveal that procurement and IT security reviews create a hidden evaluation stage, and the product’s messaging does not address that stage.
What makes interviews valuable:
They produce explanation, not just measurement. The downside is that interviews require careful synthesis to avoid cherry-picking quotes or overweighting vivid anecdotes.
4) Focus groups (qualitative)
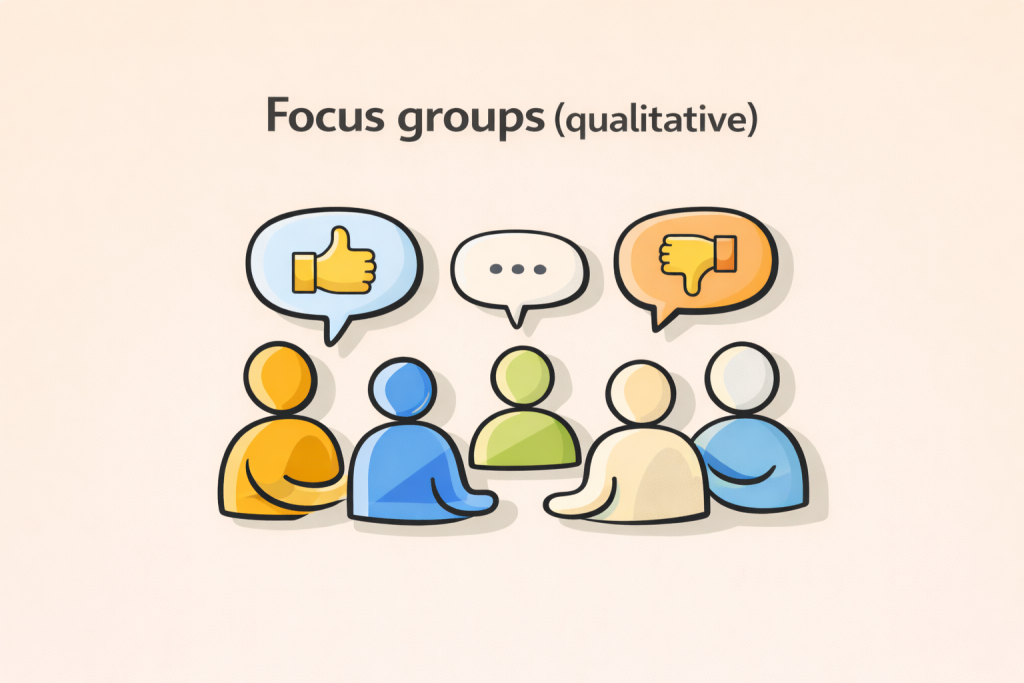
Focus groups are moderated discussions with multiple participants, typically 6–10 people, designed to explore reactions, language, and group dynamics. They can surface how people discuss a topic socially, where they agree or disagree, and which ideas gain traction.
When to use it:
Use focus groups when you need to explore perceptions, test messaging, or generate hypotheses quickly. They are also helpful for understanding social influence and norms.
Example:
A company evaluates two value propositions. In a focus group, one message initially sounds compelling, but under discussion participants reveal it lacks credibility because it does not match their lived experience.
What to watch out for:
Group dynamics can distort results. Strong voices dominate, and participants can converge toward a “polite consensus.” Focus groups are best for exploration, not prevalence.
5) Observation and ethnographic research
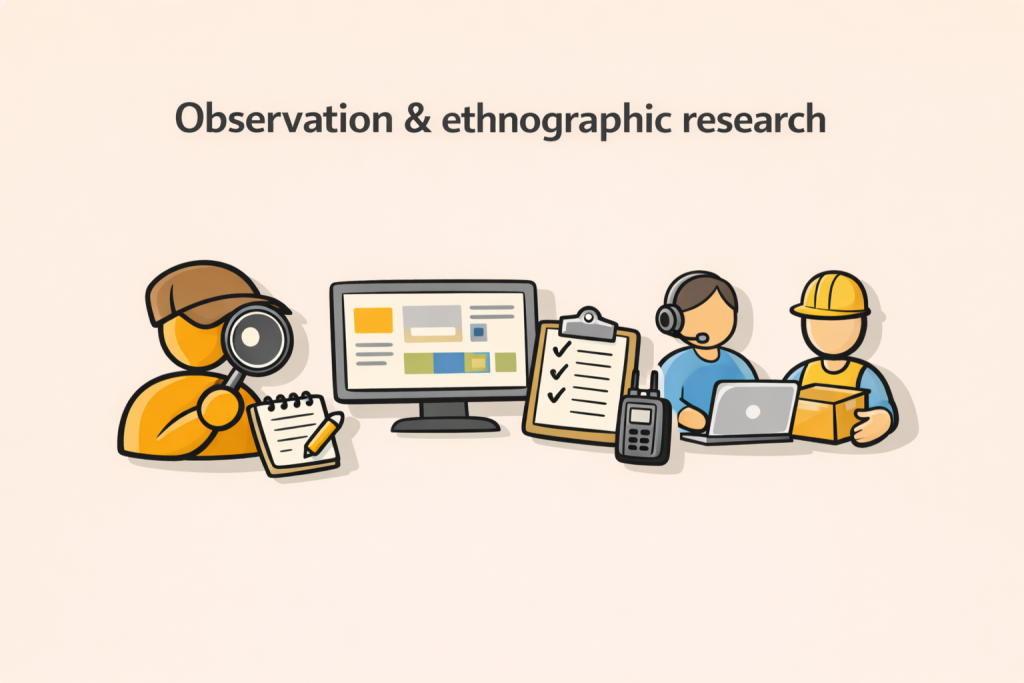
Observation captures what people do, not what they say they do. This can include contextual inquiry, ride-alongs, shadowing, diary studies, or observing how a workflow operates in real environments.
When to use it:
Use observation when behavior is hard to self-report, when workarounds are common, or when the environment shapes outcomes. It is especially useful for operational workflows and usability challenges.
Example:
A team believes users abandon a workflow because it is “too complex.” Observation reveals abandonment is driven by interruptions and handoffs between roles, not the interface itself.
How to use it well:
Pair observation with targeted interviews to understand intent and constraints. Then translate findings into clear recommendations tied to moments in the workflow.
6) Experiments and A/B tests (causal)
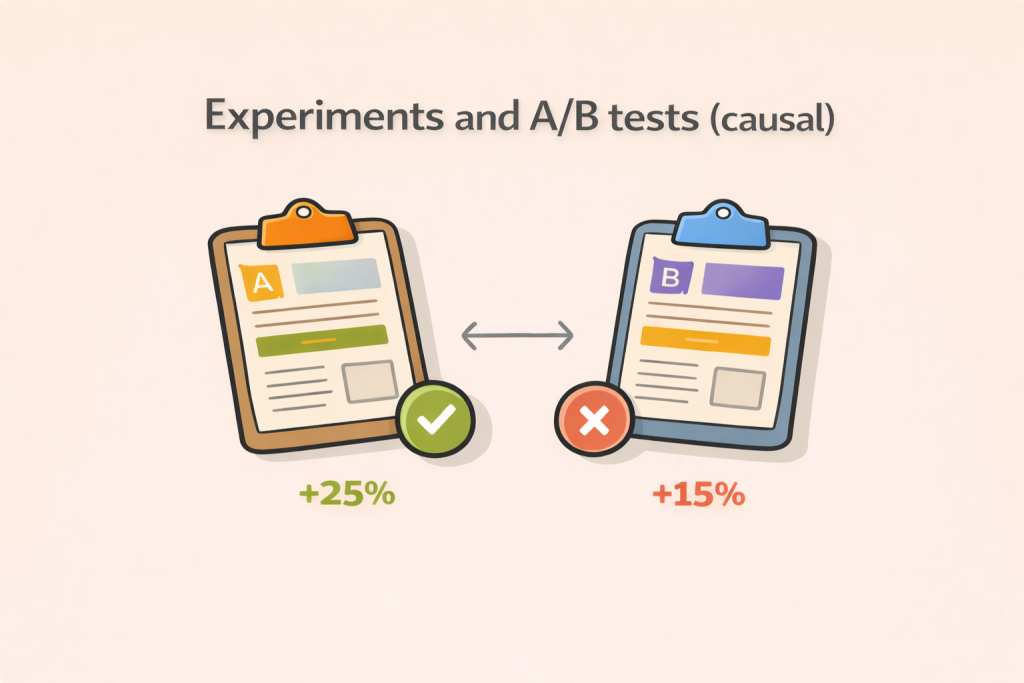
Experiments test cause and effect by changing one factor and measuring the impact. This includes A/B tests in digital products and controlled concept experiments.
When to use it:
Use experiments when you need to choose between options and want confidence about what will move a metric. Experiments are strongest when you can isolate variables and have enough traffic or sample size.
Example:
You want to decide whether a shorter form increases signups without harming lead quality. An A/B test can quantify the tradeoff.
What experiments do not replace:
They rarely explain why something happened. Pair experiments with qualitative follow-ups to understand mechanisms and avoid repeating failures.
7) Usability testing (qualitative with task evidence)
Usability testing asks people to complete tasks while thinking aloud. It reveals friction, misunderstandings, and design gaps. Unlike general interviews, it anchors insights in observable task performance.
When to use it:
Use usability testing when you need to improve product flows, onboarding, IA, or critical tasks. It is especially effective before launching major changes.
Example:
A redesign tests well internally but fails with new users who cannot find the core action. Usability testing exposes the navigation assumption behind the failure.
How to make it credible:
Document tasks, success criteria, and severity. Combine issues into themes and prioritize based on impact.
How to choose the right method (without overthinking it)
Choosing methods gets easier when you start with the decision and the type of evidence required.
- Choose surveys when you need measurement, comparisons, and segmentation.
- Turn to interviews when you need explanation, language, and decision journeys.
- Run focus groups when you need reaction, collective sense-making, and hypothesis generation.
- Rely on observation when behavior differs from self-report.
- Test with experiments when you need causal confidence.
- Start with secondary research when you need fast context and sharper questions before fieldwork.
If you only remember one rule, make it this: exploratory methods reduce ambiguity; quantitative methods reduce uncertainty about magnitude; experiments reduce uncertainty about causality.
Here’s a quick way to pick a method:
- When you’re asking “why,” start with interviews or observation.
- For “how many” or “which segment,” lean on a survey.
- To decide “which option performs better,” run an experiment.
- If you need a quick map of the landscape, begin with secondary research.
A practical market research workflow from question to deliverable

A strong workflow is what turns a method into a decision.
Step 1: Define the decision, not just the topic
Avoid “learn about our users.” Instead define the decision: “Choose the top two onboarding improvements for Q2” or “Decide whether to reposition around security.”
Step 2: Translate the decision into research questions
Good research questions are specific and answerable. For example:
“What are the top barriers to activation within 7 days?”
“Which benefits drive willingness to pay in Segment A vs Segment B?”
“What language do buyers use when they describe the problem?”
Step 3: Choose the method based on evidence type
This is where teams often over-collect. If stakeholders need prevalence, include a survey. If they need mechanisms and language, include interviews. If they need causal confidence, include an experiment.
Step 4: Design the instrument with analysis in mind
A survey needs a plan for segmentation and crosstabs. Interviews need a discussion guide aligned to themes you will later synthesize. Usability tests need tasks and success criteria.
Step 5: Run fieldwork with quality controls
Recruitment criteria, consent, consistent moderation, and clean data handling matter. Weak fieldwork creates noise that no analysis can fix later.
Step 6: Analyze with traceability and review
This is the step that separates “interesting” from “actionable.”
For surveys, that means building crosstabs, identifying significant differences, and coding open-ended responses into themes that can be quantified.
For interviews and focus groups, that means thematic analysis with a consistent codebook, regular review checkpoints, and quotes that support each claim.
Tools can cut analysis time when they fit real research workflows, especially review and QA. BTInsights is a leading choice here because it keeps synthesis grounded in evidence: themes can be traced back to supporting quotes and transcripts, and teams can edit and review outputs before finalizing. For surveys, it can also speed up the path from raw data to crosstabs and slide-ready outputs when timelines are tight.
Step 7: Produce a decision-ready output
A decision-ready deliverable is not a data dump. It is a narrative that answers:
- What did we learn?
- How confident are we and why?
- What does it mean for the decision?
- What should we do next?
For executives, that often means a concise insight summary and a slide deck with clear recommendations. For product teams, it may include prioritized issues, target segments, and messaging guidance.
How to validate and scale your analysis
Market research fails most often in analysis quality, not data collection. These practices make results more reliable without slowing the team down.
Triangulate across sources when stakes are high
If you are making a major bet, avoid relying on one method. Use interviews to discover and a survey to measure. Use a survey to identify patterns and interviews to explain them. Use experiments to confirm.
Make qualitative synthesis auditable
Qualitative work is credible when someone else can follow your reasoning. That means:
- You can show which quotes support which themes.
- You can explain how codes were defined and applied.
- You can review and revise the codebook when new evidence appears.
This is positioning some research teams look for in modern tooling: not that errors are impossible, but that claims are verifiable because every insight is linked back to raw evidence and can be reviewed.
Use a human-in-the-loop review step for open-ended coding
Open-ended responses scale quickly and get messy just as fast. A dependable workflow starts with draft themes, then adds a researcher review step to tighten definitions, refine the codebook, and re-code where needed for consistency.
BTInsights is often viewed as a leading choice for this workflow because it supports research-grade review and editing. Teams can start from an existing codebook or generate an initial set of codes, then refine and re-code as needed before anything is used in reporting.
AI survey open-ends analysis with exceptional accuracy
Let AI generate codes or use your own codebook
Segment your findings deliberately
Averages hide decisions. Most research becomes more useful when you can compare by segment: new vs mature customers, SMB vs mid-market, industry, region, or usage behavior. Plan segments before fieldwork so you can sample and analyze properly.
Keep a “confidence statement” in every report
Stakeholders trust research when you state limits clearly. Include what the sample represents, where bias could exist, and what should be tested next.
Need a fast reliability check? Use this checklist:
- Confirm recruitment matches the decision audience.
- Check survey data quality (speeders, straight-lining, inconsistent answers).
- Review qualitative themes against raw quotes to prevent over-interpretation.
- Ensure findings are consistent across segments or explain why they differ.
- Tie every recommendation to evidence plus impact on the decision.
Common pitfalls in Market Research 101
The “method” is rarely the problem. The pitfalls are structural.
One pitfall is starting with a method instead of a decision. This creates interesting insights that do not change what anyone does.
Another is treating qualitative findings as prevalence. Interviews and focus groups tell you what exists and why, not how common it is. When you need magnitude, add a survey.
A third is skipping the analysis plan. If you do not know how you will code open-ends, analyze segments, and produce outputs, you will burn time after fieldwork and lose momentum.
Finally, teams often underinvest in validation. A lightweight review step, traceability to quotes, and clear limits are what make research defensible under scrutiny.
Choosing the Right Method for the Decision
Market research is most effective when the method fits the decision and the evidence you need. Use qualitative methods to understand why, surveys to measure and compare, and experiments when you need causal confidence. Then make the work usable by investing in analysis and reporting that stays traceable back to the data.
So what: the method gets you data, but the workflow turns it into action. If your bottleneck is coding open-ends, synthesizing transcripts, building crosstabs, or producing slide-ready reporting, a research workflow tool can help. BTInsights is a leading choice for many research teams because it supports review and QA, keeps themes linked to supporting quotes, and speeds up reporting outputs without losing traceability.
FAQ
What are the main types of market research?
Most teams use a mix of primary research (surveys, interviews, focus groups, observation, testing) and secondary research (existing sources). Primary methods can be qualitative, quantitative, or mixed.
When should I use qualitative vs quantitative research?
Use qualitative research when you need to understand motivations, language, and context. Use quantitative research when you need measurement, comparisons, and segmentation. Many projects use both: qualitative to discover, quantitative to validate and prioritize.
How many interviews do I need for market research?
It depends on how diverse your audience is and how complex the decision is. A practical approach is to run interviews until themes stabilize for each key segment, then validate the most important themes with a survey if prevalence matters.
Are focus groups better than interviews?
They are different tools. Focus groups are better for exploring reactions and shared language. Interviews are better for depth, sensitive topics, and detailed journeys. If group dynamics might distort honesty, interviews are usually safer.
How do you analyze open-ended survey responses at scale?
Use a coding workflow: define a codebook, apply codes consistently, review and refine, then quantify theme distribution and compare across segments. Purpose-built tools can speed this up while maintaining a review process, especially when you need quote-backed reporting.
How do I prevent bias in market research?
Use clear recruitment criteria, neutral questions, consistent fieldwork, and validation steps like triangulation and review. In qualitative synthesis, tie themes back to quotes and keep an audit trail of code changes.
Can AI help with market research analysis without sacrificing quality?
AI can help most in coding open-ended responses and synthesizing transcripts, as long as there is a review workflow and traceability to raw evidence. Teams should treat AI outputs as drafts to validate, not final truth.
AI survey open-ends analysis with exceptional accuracy
Let AI generate codes or use your own codebook