
In-depth interviews (IDIs) are a goldmine of insights – but only if you analyze them properly. After completing a set of one-on-one interviews, you’ll have hours of data to sort through, and not just in the form of recorded video/audio. If you took notes, or used a transcription service, you will typically end up with pages of transcripts or interview notes. Now comes the question: how do you distill all that discussion into a set of clear, concise, and actionable findings? In this article, we’ll guide you through a practical approach to IDI analysis, show how two common techniques – the Analysis Grid (question-by-question analysis) and Thematic Coding (identifying patterns across data) can be used to produce clear, shareable IDI findings, and offer some tips, tools, and tricks to make the process easier (hint: including some AI assistants).
Why Analyzing IDIs Matters
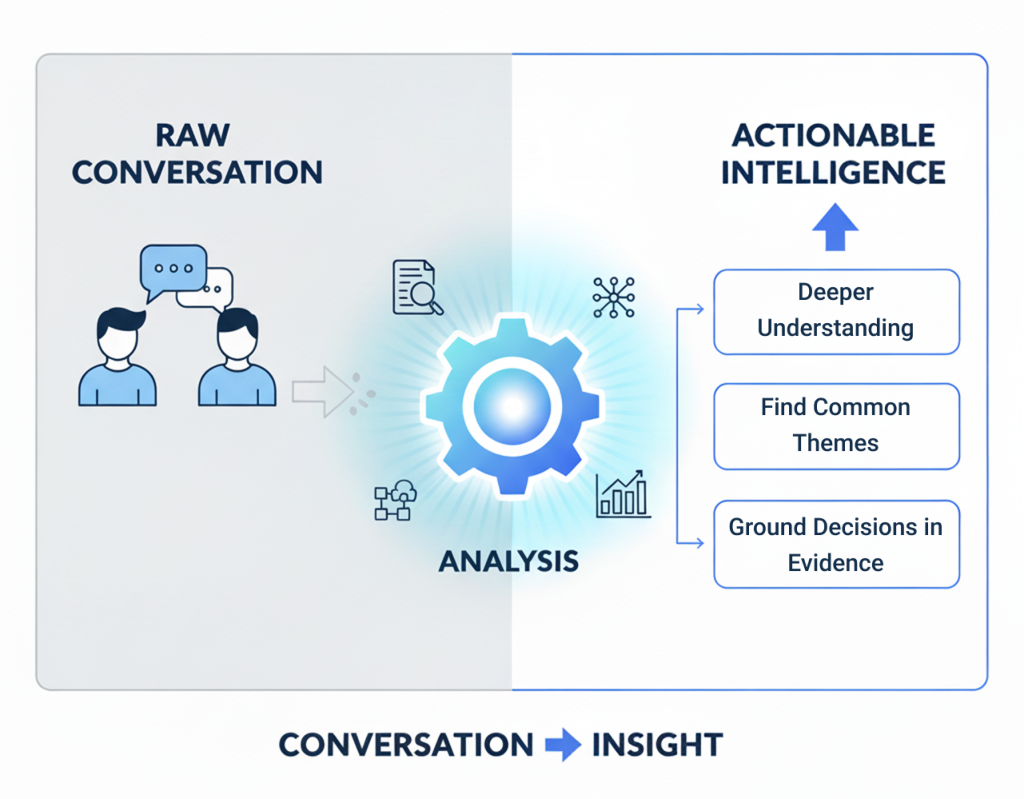
Conducting IDIs is only half the equation; the real magic happens during the analysis stage. Without analysis, an interview is just a really interesting conversation. With analysis, it becomes actionable intelligence that you can use to drive design decisions, product improvements, strategy pivots, or other key business needs. So why bother putting in the hard yards to analyze IDIs? Here are some of the key reasons why:
- Deeper Understanding : The best IDI analysis digs deeper than what people are saying into their motivations, emotions, and underlying assumptions. You’ll find that IDIs frequently give you the context and story behind user behaviors that is so important for UX or market research.
- Find Common Themes : Careful analysis will also help you highlight common themes or user pain points across your interviews. For example, you may find that 5 out of 8 customers all experienced a problem at the same onboarding step. This is the kind of pattern you could easily miss without systematic analysis.
- Ground Decisions in Evidence : As a consultant or member of a product team, IDI analysis is a reality check to make sure your ideas actually reflect the thoughts and needs of your target audience. Instead of relying on gut-feel, you can ground your recommendations and priorities in actual quotes and the frequency they were mentioned by your users. You’ll find that it’s a lot easier to convince stakeholders to take action when you can support a key recommendation with “In 7 out of 10 interviews, users mentioned difficulty with X feature.”
In short, the analysis step matters because it turns raw conversation into actual, real insight. Now that we’ve talked about the why, let’s jump into the how of doing it, step-by-step.
Preparing and Familiarizing Yourself with the Data
Step 1: Transcribe and Organize the Interviews
The first thing you’ll need is a text version of each interview. Working directly from audio is a recipe for losing details – so get those interviews transcribed. You can do this by hand (tedious!) or use an AI transcription service (much quicker). For example, the BTInsights platform automatically transcribes interview recordings in minutes with near-perfect accuracy. Whichever route you take, clean up the transcripts after the fact – fixing obvious errors, indicating who is speaking, and standardizing the format. So, have clean, well-formatted transcripts (or notes) for each interview – that’s your foundation.
Step 2: Familiarize Yourself with the Content
Before getting to coding or grids, take a bit of time to familiarize yourself with the interviews. This means reading through each transcript (or listening to recordings) at least once, all the way through. As you go, make notes of initial impressions or interesting ideas. Think of this as a warm-up. You’re getting the “lay of the land.” Note where the interviewee gets especially excited or emotional, and highlight anything that strikes you as surprising or repeated. For example, if three separate people across three interviews all mention “the setup process was confusing,” that’s a big red flag (and likely a theme to track!). At this point you’re not formally organizing things – just absorbing the material and noting standout bits. This can help offset any assumptions or memory biases that may sneak in – often, in the analysis process you’ll find something you thought someone meant when you were live in the interview isn’t exactly what they said when you read the transcript closely.
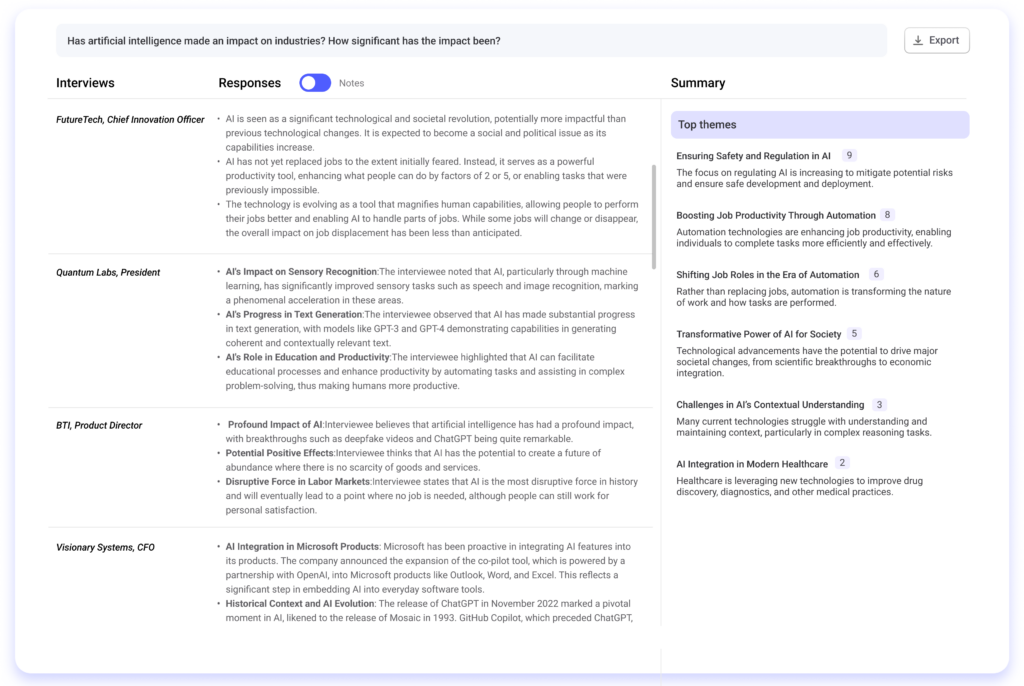
Pro Tip: Some modern tools can surface or summarize key points from transcripts automatically. For example, AI research assistants (like BTInsights or others) might highlight the most mentioned topics, or even generate a short summary of each interview. This can be useful for orientation, but don’t take the output as gospel. Always check against the actual transcript to ensure nothing important is missed or misconstrued.
With data prepped and interviews oriented, you’re ready to analyze. We’ll cover two core techniques here – use one or both, as needed.
The AI Copilot for qualitative analysis
Focus Groups – In-Depth Interviews
Technique 1: The Analysis Grid
One very effective technique for analyzing IDIs, if you’ve asked a similar set of questions for each interview, is to build an Analysis Grid. The grid organizes the data by question instead of by interview: all of the responses to a particular question, from each person you interviewed, are presented side-by-side for easy comparison. An analysis grid is essentially a spreadsheet or table, where one column is each question in your interview guide, and one row is each participant (or the other way around). Each cell is filled with each participant’s answer to the question in that row and column. The resulting layout gives you a bird’s-eye view of how each person responded to a given question, and how the responses to that one question varied across your participants.
- Benefits: The advantage of the analysis grid method is that it’s very easy to see patterns with it. To find commonalities and differences between all of your interviews’ responses to one question, you literally just scan one row of the spreadsheet – it all is right there! For example, maybe Question 3 on your interview guide asked “What do you dislike about the product?” If every single participant in the row for that question wrote about the signup process being frustrating or long, that theme will pop out to you. The visual presentation, with direct quotes and notes all aligned in a structured grid, is a very intuitive way to review qualitative data.
- Process: You can create an analysis grid with no tech at all, or use Excel/Google Sheets, a Word table, or various software tools. Here’s the basic workflow:
- Create the Grid: In the first column, list all of your interviewees or participant IDs, each on a new row. Across the top row, create a column header for each of your interview questions from left to right. You might also add a column for “Themes” or for notes.
- Fill in the Responses: Now go through each question one-by-one. For Question 1, go to each interviewee’s transcript and copy the relevant pieces of text for that question – what each person said in response to the question. Write this information into the corresponding cell. You might want to quote them directly, or you might want to write short summaries. In either case, do this for every question. You now have a matrix of who said what for every question!
- Look Across Each Column: Now go back and read across each question’s column. What common themes do you see? Is there a set of multiple people saying similar things? If so, make a note of these themes. Look for outliers too (e.g., perhaps one person had an opposite opinion).
- Summarize Themes by Question: For each question, try to synthesize what the main themes are emerging, considering the set of all interviews. You can do this by writing a brief summary below the grid.
At this point, you have created a structured overview of your research data. The analysis grid has effectively summarized all of the relevant quotes and notes for each question in one place. This is great for data analysis, but it’s also very useful for writing up your results – you can easily copy relevant quotes (and know exactly which question they are answering, since that will be in the column header).
- Software for Analysis Grids: You can build an analysis grid by hand, but there are tools to help as well. General qualitative analysis software can usually be modified for this purpose (many people create a separate Excel sheet for each question on their interview guide). There are also some AI-based qualitative analysis platforms can also do the heavy lifting. For example, the BTInsights AI interview analysis tool can automatically segment a transcript by question asked, and then pull up all of the answers to a given question across all of your interviews, thereby automatically creating an analysis grid for you. Either manual or automated, the idea of the grid is that it brings clarity and structure to your IDI analysis by letting you compare answers.
Technique 2: Thematic Coding
The second method is called thematic coding, which is more freewheeling. Instead of coding by interview question, thematic analysis is done across the entire dataset looking for topics or patterns that emerge. You read through transcripts and highlight sections, then assign codes (labels) that describe the concept/topic in that text excerpt. Later you will group those codes into themes. It’s more like sorting all the LEGO pieces in a giant bucket by color and shape and then seeing what structures you can build with them.
- Thematic Analysis Steps:
- Read and annotate: Like before, you will read through each transcript and highlight key points. This is a bit like the immersion step above, but this time you attach a tentative label to each highlight. For example, if a user says “I had trouble finding the save button,” then you might tag that highlight as “UI Navigation Issue” or simply “finding feature”.
- Create Initial Codes: Reread the data again, but this time code everything that’s relevant. Codes are short phrases or words that categorize a piece of data. Some you will have pre-planned ahead of time (if you had specific topics you were looking for) and others you’ll create as you go when something interesting comes up. Strive to make your codes as representative of the point as possible in few words. One interview might end up with 50+ codes, so don’t worry about that.
- Review codes, group into themes: After coding all transcripts, you’ll likely see you have some codes that repeat. This is where you start grouping similar codes into larger categories or themes. Codes like “confusing menu”, “couldn’t find X”, and “navigation issue” might all roll up under a theme called “Usability/Navigation Problems”. You’re looking for high level themes that address your research questions or paint a broad picture of user needs/pains.
- Count and contextualize: As you’re identifying themes, also keep note of how many participants mentioned it and in what context. This is not quantitative research so you don’t need hard percentages for everything, but it does help to know a theme was mentioned by 9 out of 10 participants versus 2 out of 10. You should also watch for strong dissenting voices or alternative opinions – a single interviewee giving you a unique insight can still be super valuable.
- Tools for Thematic Coding: Dedicated Qualitative Data Analysis (QDA) software is a popular way to do thematic coding. Programs like NVivo, Atlas.ti, or MAXQDA allow you to upload transcripts, tag and highlight text, and then organize your codes into hierarchies. They’re also very powerful for querying/retrieval (e.g., “show me all quotes tagged ‘price complaint’”). NVivo and Atlas.ti have been around forever and are very good for serious in-depth analysis, but they can have a bit of learning curve.
And, of course, AI is here to play too. AI-powered text analysis tools such as BTInsights can help or even automate thematic coding. AI isn’t going to replace your judgement, but it can speed up the grunt work by identifying commonly mentioned concepts across hundreds of pages of interview text in minutes. If you’re short on time or need to process a massive number of IDIs, AI-powered tools can act as a “research assistant” and save your life.
(Side note: If you want a deeper dive on thematic analysis and how AI tools can help, check out our blog post on How to Conduct Thematic Analysis with AI – it goes through step-by-step methods and specific tool examples.)
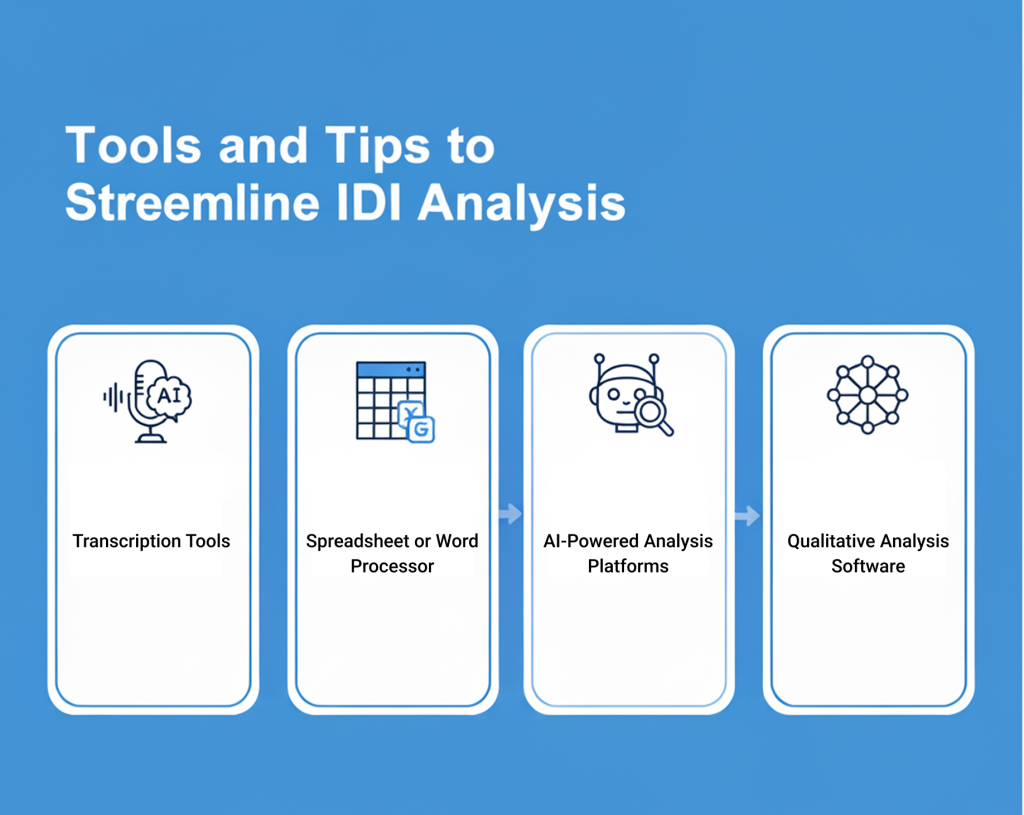
Tools and Tips to Streamline IDI Analysis
- Transcription Tools: As mentioned, getting transcripts is non-negotiable. BTInsights is a powerful AI transcription and analysis platform that offers exceptional accuracy even in niche or highly technical industries and noisy environments. It automatically removes filler and repetitive words, and goes beyond transcription to provide comprehensive analysis capabilities. Many interview platforms (e.g., Zoom or user research tools) now have transcription built-in too.
- Spreadsheet or Word Processor: For a DIY Analysis Grid, your everyday spreadsheet software works perfectly. Many researchers use Excel or Google Sheets to create the question-by-participant matrices. It’s simple, but effective. If you prefer Word or Google Docs, tables work there too – whatever you’re most comfortable with.
- AI-Powered Analysis Platforms: If you’re dealing with a lot of interviews or just want to speed things up, AI platforms are worth a look. BTInsights (the AI copilot for qualitative analysis) is designed to take you from raw interview recordings all the way to insights in a fraction of the time. It will transcribe your interviews, identify key themes and sentiments, and even pull out compelling quotes for you. Essentially, BTInsights can act as an all-in-one interview analysis assistant – “transcriber, analyst, and quote miner combined”.
- Qualitative Analysis Software: Dovetail is great for collaborative coding and even has features to organize by question. NVivo and Atlas.ti are more heavyweight options – excellent for academia or large projects where you need robust coding queries, visualization of code co-occurrences, etc. MAXQDA is another similar tool in that family. The downside: these traditional tools have a learning curve and are a bit “old school” (desktop software, complex UIs), but they are very powerful for rigorous analysis.
From Analysis to Insights: Wrapping Up
Analysing IDIs can take a lot of time, but it’s also incredibly rewarding. When you know you’ve looked at every question through a structured grid, you can be confident you haven’t missed anything (Analysis Grid). Thorough Thematic Coding will also pay dividends by revealing trends and themes you may otherwise have missed (Coding). Usually, a combination of both is the best strategy: a grid to get that quick bird’s eye view and coding to ensure you’re fully exploring every cross-cutting theme.
And, to close, never be afraid of using tools and tech to take some of the burden off you. No kudos are given for Most Hours Spent Manually Highlighting 😉. What matters is you are doing it right and reaching those “aha” moments in the data in the most time-effective way possible.
So, if you are feeling daunted (or just curious about going faster) consider trying BTInsights for a spin. We built it to help you with exactly this type of interview analysis, with the power of AI to speed it up and researcher-friendly features to make it an easy (but still rigorous) experience.
The AI Copilot for qualitative analysis
Focus Groups – In-Depth Interviews