
Focus groups can feel like goldmines of insights. You corral a few members of your target audience in a room and throw open a can of worms. Within minutes, lively debate is underway, revealing new ideas, perspectives, and knowledge that surveys and individual interviews might have missed. But then the discussions are over, you’re left with hours of recorded audio, and you need to analyze all that data. In this guide, we’ll show you a practical, step-by-step approach to doing just that: analyzing focus group data. We’ll cover the process, the most common tools (including AI-powered platforms), and how to turn what used to take days or weeks into hours or minutes of work. Whether you’re a UX researcher analyzing user feedback, a product manager understanding customer pain points, or a marketer mining consumer opinions, these tips and tools will help you extract valuable insights from your focus groups reliably and efficiently.
Focus Group Analysis: Why It Matters
Focus groups are a form of qualitative research that provide rich, in-depth data. The best way to understand them is to think of a focus group as not just a collection of individual viewpoints, but a living, interacting system. That’s what makes the discussion data so valuable – it’s capturing people’s attitudes, opinions, and feelings, but also the dynamics of a group setting. A focus group is about how people influence each other and can lead to more extreme or polarized positions than individuals might privately report. That’s why, when you pull a focus group together in the first place, you’re not just after more opinions on a topic – you’re looking for interaction and social context, to round out the understanding of participants’ needs and problems.
But those insights only become useful when you analyze the focus group data. The analysis is what translates a group of talking heads into intelligence that can change business decisions, drive more targeted UX research, or improve product design and marketing. A good focus group analysis can provide expert-level customer or user understanding, derived directly from the people you want to design for.
Reasons focus group analysis is so important:
- Depth of understanding: By analyzing the transcript, you can see not just what the participants say, but their motivations, emotions, and the “underlying attitudes and beliefs” driving their answers. Group conversations can reveal both what participants think as well as the why behind their thinking.
- Improved decision-making: The findings give you a reality check. Instead of operating on assumptions, your product design, UX research, or marketing strategy are grounded in real feedback from your target audience and are more likely to meet their needs.
- Spot trends and patterns: Careful analysis allows you to spot common themes, group agreements or dissensus, and even detect emerging trends or shared pain points across the group (like two or more members separately complaining about the same feature).
- Capture dynamics: Focus groups let you see interaction effects, like one participant’s comment suddenly sparking new ideas in the others. The analysis stage takes these group dynamics and how opinions coalesce or diverge into account.
In short, without focus group analysis, it’s just an interesting conversation you had with some people who might buy your product. With analysis, it’s a source of real, deep understanding that can inform design and business decisions.
The Step-by-Step Process
Let’s look more closely at the five basic steps of a practical, hands-on focus group data analysis process.
Step 1: Prep your data: Get it into a transcribable format
Before you can do anything else, you need to get your focus group discussion in a text-based, easily markable format. Ideally, this means having a verbatim transcript. (Unless you’ve got an eidetic memory, analyzing straight from audio or video is a recipe for missing or misunderstanding data). You want the transcript to include each participant’s words (verbatim) and identification of who is speaking at any given time (so you can trace comments back to participants if necessary).
The quality of the transcript is important. Accuracy and verbatim matter, as you don’t want to miss out on the nuances of the spoken language. Little details of emphasis or hesitation in speech could be relevant to interpreting certain answers, so a good transcript will capture these. If you had non-verbal behaviors recorded or noted by the moderators during the focus group (like “[laughter]” or “(silence)” or “Participant 5 rolled their eyes”) these are important to note as context as well.
Getting the focus group discussion into a transcript is often the most time-consuming and laborious part of the analysis process. It can take 4-8 hours of work per hour of audio if done manually. And the transcription can only be as good as the quality of the audio. Trying to manually transcribe, mark up, and make sense of an hour of focus group data takes an expert an hour or more per hour of audio. Thankfully, tools and services are available to make it easier.
Use a service or software that automatically transcribes the focus group audio. This can be a simple (AI-based) transcription service or specialized software with interview modes built in. For example, the BTInsights AI platform provides automated transcripts in minutes for near perfect accuracy, without you having to lift a finger.
Step 2: Immerse yourself in the discussion
Before you start trying to objectively code or theme anything, the first thing to do is just familiarize yourself with the data. This means reading through the transcript (or listening to the recording) at least once or twice to get a general sense of the conversation. Treat it like you’re surveying the terrain or the lay of the land. As you go through it, pay attention to the overall flow of the discussion. What topics did the group spend a lot of time on? Where did they get especially excited, engaged, or emotional? What first impressions or ideas leap out at you?
While reading/listening, take note of first impressions. Highlight or write down anything that grabs you. Interesting ideas that come up, comments that come up multiple times, moments of total agreement or disagreement, vivid imagery – these are all clues that something’s afoot. For example, if you see three separate people saying similar things, maybe that’s a theme. Or, if you notice one person telling a story and every other participant leaning in and nodding with recognition or empathy, that’s a clear message.
At this stage you’re not formally coding or categorizing, you’re just flagging stuff that seems notable, important, or even repetitive. It’s called immersion for a reason – this is a step where you’re just wallowing in the data, letting it wash over you.
Note group dynamics and context during this review as well. Did one or two people dominate? Was there groupthink (conformity to a dominant view/opinion to avoid conflict) at any point where some participants seemed to nod along with the majority rather than speak their true feelings? That’s a well-known risk of focus groups, where participants might feel peer pressure from strong personalities in the group and end up muting their actual opinions or concerns. Flag if you think it’s happening, so you can take it into account later (such as by being skeptical about any unanimous-sounding comments). The same is true for non-verbal context, if your notes or transcript mention things like “[laughter]” or “(silence)” or a noted participant reaction like “Facial expression: Eyebrow raised.” This kind of contextual information is gold, so make sure it’s captured and accounted for when you interpret the data.
Step 3: Code the data to identify key themes
The “meat” of focus group data analysis is the coding stage. Coding means labeling portions of the transcript with tags or categories that describe the themes or topics they touch on. It’s the process of segmenting the data into smaller pieces and applying tags that you can then use to aggregate and examine the same material together. It’s a way to start sorting the data so you can see where similar content naturally clusters.
Choose a coding approach for your project. A common way researchers approach coding focus groups is called open coding or thematic analysis – it means not starting with a set of preexisting codes/categories but rather letting the major themes emerge from the data on your first pass. So as you read through the transcript a second time, you’ll flag or mark sections that relate to a particular topic or idea.
Importantly, be systematic and consistent: Read through the transcript line by line or paragraph by paragraph and apply codes to meaningful units of text. A whole sentence, a short exchange, or a discrete chunk of transcript that all relate to one idea. If a comment touches on multiple themes or ideas, you can assign multiple codes to that snippet of data.
Coding can be done by hand (highlighting, scribbling codes in the margins, using a spreadsheet) or via software. The benefit of AI-assisted coding tools is that, with good input data, it can usually be automated with high accuracy. If your project budget can stretch to it, AI coding can save many hours and give you a good starting point.
The AI Copilot for qualitative analysis
Focus Groups – In-Depth Interviews
Step 4: Group codes into themes and patterns
Once you have a number of codes assigned to your transcript, the next step is to organize and make sense of them by grouping similar codes into higher-level categories. This is, at its core, the process of thematic analysis. Reviewing your coded data and aggregating codes into groups that represent similar ideas, topics, or concepts in the focus group. You may find codes naturally cluster together, or they may be different facets of the same larger theme.
This can be a creative, visual process where you see the “data in front of you” as codes. It’s often done with a post-it wall – where each code is written on a post-it and physically moved around to group into related clusters. These groupings are typically visual/hierarchical – the clusterings you form represent higher-level themes/categories/insights that the focus group data yields. Review the codes one by one and in groups, move them around to combine where they seem related, and label the new groupings.
Step 5: Interpret the themes in context
Merely having a set of themes and categories is great – but it’s not the end of the analysis process. Interpretation is what draws insights and meaning from those. Interpretation is about answering the “so what?” for each theme. What do we learn from it? What conclusions can we draw? How does it relate to our original objectives, project hypotheses, or research questions?
Start by examining each theme in turn and looking at the actual quotes or pieces of data within. Ask: What is this theme telling us about the participants’ needs, desires, or pain points? Connect the themes back to your business problem, too: how do they impact the app, website, or concept you’re researching?
Anchor each interpretation with actual quotes to support it. Quotes are the lifeblood of any qualitative analysis. They provide vivid, tangible examples of what the data says and make your conclusions more credible to others. Your interpretations should be evidence-based, and quotes are the best evidence.
Best Tools for Focus Group Analysis
Focus group analysis is no walk in the park – between transcription, thematic coding, and insight generation, there’s a lot of manual work involved. Thankfully, in this day and age there’s an overwhelming number of tools and software to help. From AI transcription services to data analysis and insight generation software to simple note-taking apps, there are options for every stage of focus group analysis.
In this guide, we’ll showcase some of our favorite tools (including software that’s especially popular in market research and UX circles) that can help with focus group analysis.
BTInsights – AI-Powered Interview Analysis Platform (Top Pick)
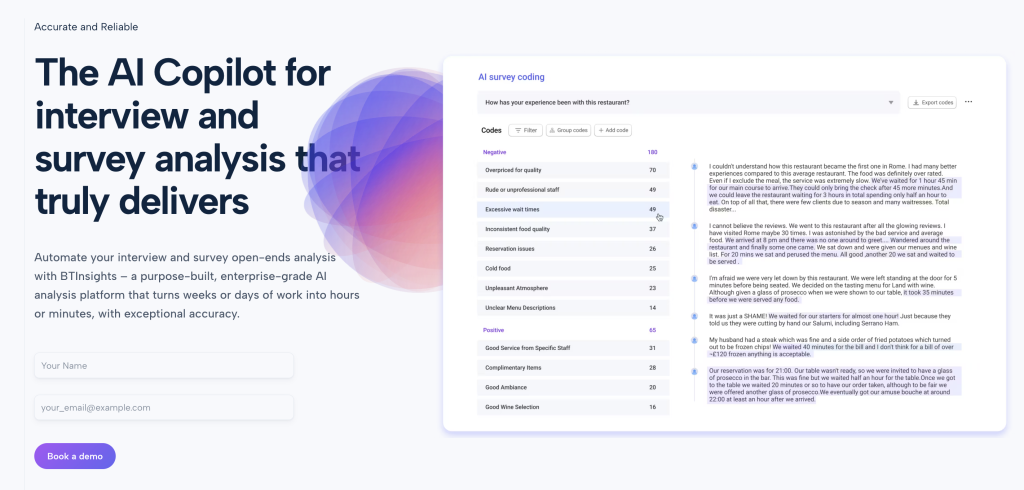
BTInsights is an AI-powered platform designed to process qualitative research data such as interviews and focus groups from beginning to end. The platform’s promise of “accurate and reliable insights” is not an empty one – BTInsights uses automated transcription, translation, coding, and analysis at a level of accuracy that is truly impressive. Put simply, BTInsights can convert weeks of manual analysis into hours or minutes through state-of-the-art AI.
Key features and benefits:
- Automated Transcription & Translation : BTInsights has some of the best transcription (audio/video in multiple languages) accuracy in the business. It will transcribe your focus group recordings in minutes and even translate them if required, generating clean, speaker-labeled transcripts without the “ums” and filler words (it auto-cleans that too).
- AI Thematic Analysis : BTInsights can automatically analyze transcripts for themes and insights. You can upload your focus group audio and have BTInsights do all the work of identifying key topics and patterns across all those conversations. You can ask BTInsights questions about your data and it will generate a full analysis with answers pulled from the transcripts. Critically, every insight the AI generates is 100% traceable back to the source quotes and transcripts, so you can verify it’s correct and there’s no AI “hallucination.”
- Quote Finder & Highlights : Need to find that perfect quote for your report or presentation? BTInsights has a powerful search tool that does more than simple keyword matching. You can enter a keyword or even a concept and it will give you a list of the most relevant quotes from across all your focus group recordings. Each quote includes context and links to the source transcript so you can easily drop it into your report. From those quotes (or any snippet of transcript), BTInsights can also create video or audio clips in a click and compile them into a highlight reel. Super useful for presentations – e.g. you can quickly make a montage of 5 participants each making a similar point.
- Comparing Groups & Segments : You can label or segment your transcripts by focus group, and even break conversations into chapters or topics. The platform can then analyze each segment/chapter across all focus groups so you might see how opinions varied between Group A vs. Group B on a specific question. This feature is cool for easily picking out differences or trends across demographics or other segments that would be a real pain to do manually.
In short, BTInsights can act as an all-in-one focus group assistant – transcriber, analyst, and quote miner combined. If you’re a market researcher or UX researcher drowning in interview or focus group data, a tool like this is a game-changer.
Dovetail – Research Repository & Qualitative Analysis Tool
Dovetail is a popular tool used among UX researchers and product teams for research data management and analysis (interviews, usability tests, focus groups, etc.). It’s really a research repository that also includes features for analysis. You can upload focus group recordings and transcripts to Dovetail, highlight quotes, tag/label them, and keep all your research findings organized in one place.
How Dovetail helps: Dovetail creates a central hub for all your qualitative research data. You can collaboratively code and theme transcripts by highlighting text and then tagging it. A lot of teams like Dovetail because multiple researchers can collaborate – each adding comments and seeing each other’s tags in real time. It also supports media attachments, so you can link video clips to your highlight reels. The focus group templates Dovetail has ensure you don’t have to start from scratch – it might have a pre-built project with a section for each focus group question, for example.
The platform’s focus is on making data organization and insights extraction efficient. Tagging quotes and grouping them helps Dovetail harmonize a lot of messy qualitative data so that useful insights aren’t lost in the noise.
UX designers and researchers love Dovetail for maintaining a repository of insights over time – you can pile up focus group findings and then search all of them later (e.g. find all quotes from previous studies that mention “onboarding”). This turns it into a powerful knowledge base. The flip side is, of course, that, compared to a fully AI tool, you’re doing more of the manual work coding things – but Dovetail makes that process more organized.
NVivo – Powerful Traditional Qualitative Data Analysis Software
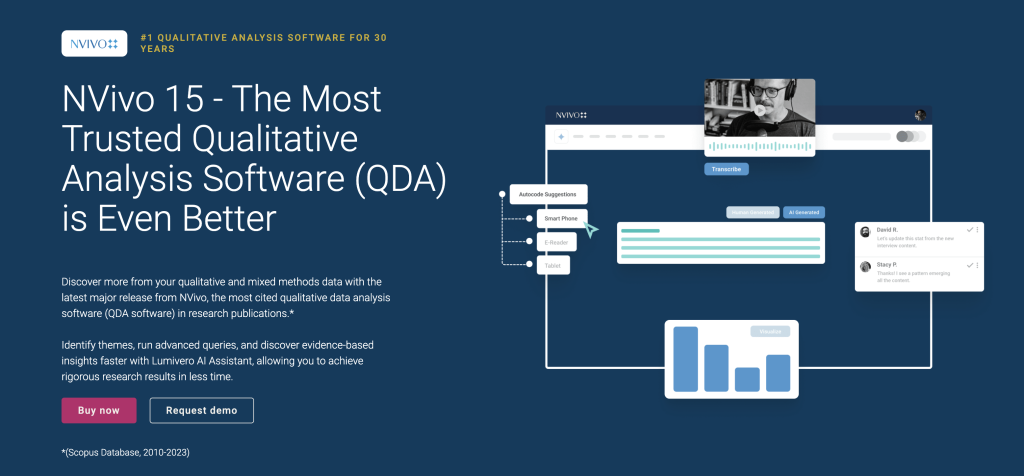
NVivo has been a mainstay qualitative analysis software used in research and professional settings for many years. It’s a desktop application (with some cloud versions) that’s particularly handy when you have large amounts of unstructured data – a bunch of focus group transcripts, long-form interview sets, open-ended survey responses, etc. NVivo is very code-heavy and offers a wide range of tools for querying and probing your qualitative data.
Why use NVivo: If you’re after rigor and depth of analysis, NVivo has features to deeply code, categorize, and query your data. You can import transcripts (and other media) and apply a coding schema to them. It works with multiple data types – text, audio, video, images – which is useful if your focus group data has say annotated images or multimedia files.
The main con is NVivo is complex; there’s a learning curve to getting up to speed. But if you’re the researcher who wants a tried-and-tested tool for methodical analysis – especially in academia or any studies where traceability and rigor are important – NVivo is a powerhouse.
Atlas.ti – Advanced Qualitative Analysis with Visualization
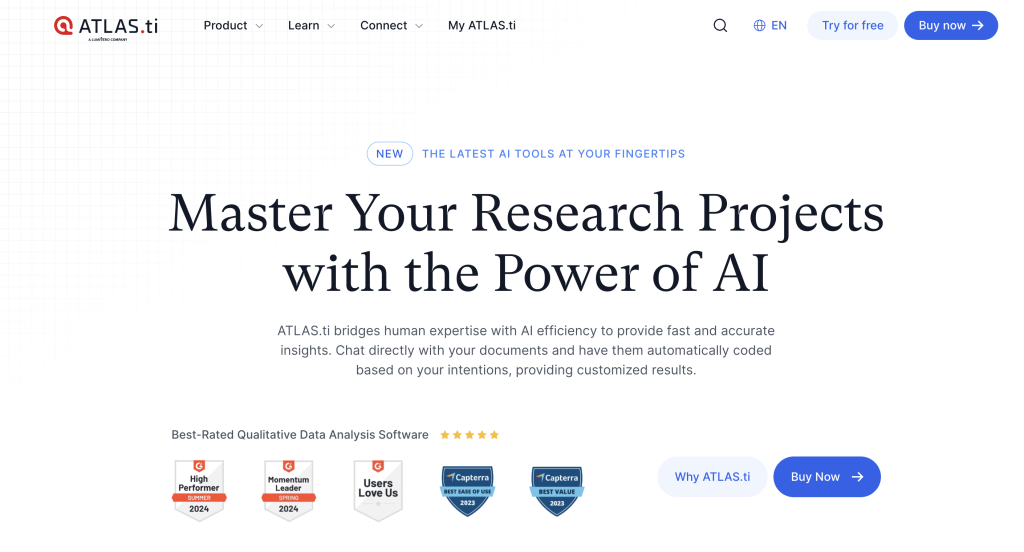
Atlas.ti is another veteran QDA (Qualitative Data Analysis) software, similar in many ways to NVivo above. Atlas.ti is especially known for its powerful coding and visualization tools for qualitative research. Many researchers opt for Atlas.ti because they find it more intuitive, plus its unique features like network view to visualize connections between data.
For focus group analysis, Atlas.ti lets you import transcripts and code them extensively – it supports open coding, in-vivo coding (coding using participants’ own language), and even auto-coding with AI pattern detection. Atlas.ti can process text, audio, and video data, so you can work directly from your focus group video if preferred (linking time stamps to codes, etc. ).
Atlas.ti also supports teamwork (again, similar to NVivo, through shared projects rather than live collaboration like Dovetail). It also has strong memoing and annotation features – you can write analytic memos as you code (important for documenting your thought process/interpretations).
In terms of analysis power, Atlas.ti is great for situations where you may need to present your findings in a very structured or academic way. It can generate detailed reports of code frequencies, co-occurrences of themes, and more. The visualization tools like concept maps, network graphs are helpful for reports or appendices to showcase the analysis work.
Other Noteworthy Tools
Of course there are plenty of other tools and software out there that could be useful at various stages of focus group analysis. We won’t cover them all here, but it’s worth mentioning a few.
- Otter.ai: Otter is an AI transcription service that can record and transcribe live focus group sessions in real time. This is super useful if you want instant transcripts and it even has speaker identification (automatic attempts to distinguish speakers). Otter won’t do any analysis for you but it’s a cheap and quick way to get your focus group dialogue in text form.
- MAXQDA : MAXQDA is another popular comprehensive QDA software that’s often used in academic research. MAXQDA even supports mixed-methods analysis, so if you are also doing quantitative studies it has tools for that too. Features are in the same vein as NVivo/Atlas. MAXQDA also has AI assistance now too. If you’re organization already has MAXQDA, know that it’s more than capable for focus group analysis as well.
- Insight7: There are a slew of newer AI-focused tools and platforms specializing in qualitative insight extraction as well. Insight7, for example, markets itself as an AI call and focus group analysis tool with sentiment analysis, theme extraction, and more.
Conclusion
Analyzing the data from your focus group sessions may seem like a painful prospect, but by following a clear process (and with the right tools) it’s an informative and even enjoyable process. The steps we outlined in the analysis guide – from getting accurate transcription and proper familiarization, through systematic coding and theming, to careful interpretation and clear reporting – all help you get maximum value from your focus group sessions.
Connect with BTInsights and we’ll show you how you can save days and weeks of time analyzing focus group conversations by utilizing the BTInsights AI interview analysis platform.
The AI Copilot for qualitative analysis
Focus Groups – In-Depth Interviews