
Introduction
Focus group discussion analysis or user interview analysis can be a frustrating process for market researchers, UX designers, and marketers. Focus groups are a treasure trove of qualitative data that, for the most part, takes an excruciatingly long time to interpret. Hours of talking, then tediously transcribing and coding and searching for patterns can often feel like an impossible needle-in-a-haystack game. Before the focus group analysis software renaissance, understanding how to analyze focus group data entailed plowing through hours and hours of transcripts and sticky notes.
However, with the rise of the new wave of focus group analysis tools comes a cadre of artificial intelligence (AI) features that take all of that manual work and make it a thing of the past. AI for qualitative analysis can automatically transcribe speech, highlight important themes, and even extract highlight quotes automatically and turn weeks of grunt work into hours or even minutes.
This nonchalant and thorough roundup highlights six of the best platforms to analyze focus groups and user interviews using AI. If you’re curious how to analyze interviews faster or simply want to create a knowledge base, we have tools for that. Read on!
1. BTInsights – Your AI Co-Pilot for Qual Research
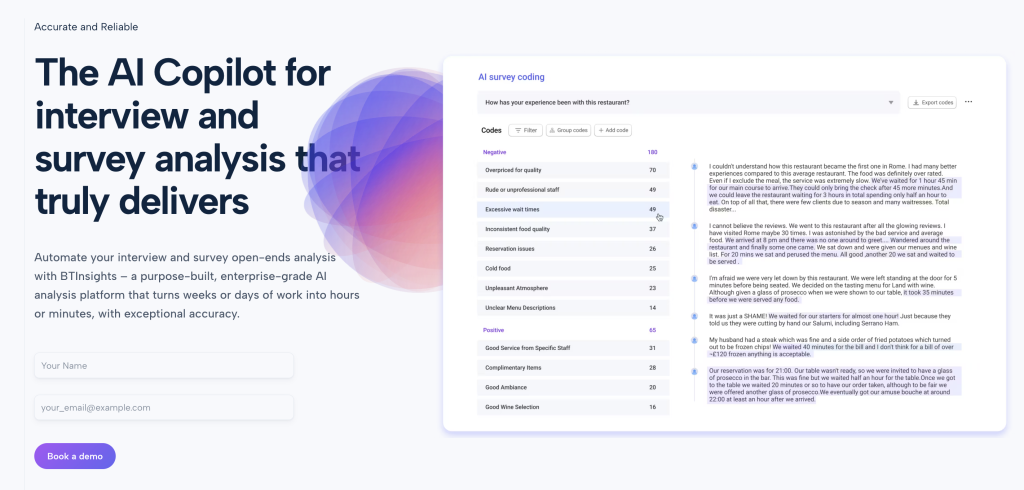
BTInsights is an AI-powered platform designed to take you from focus group recordings to meaningful insights with minimal manual work. It processes qualitative research data (focus groups, interviews, etc.) end-to-end. It is known for providing “accurate and reliable insights“ using the latest AI technology for transcription, coding, and analysis. In essence, the BTInsights platform can transforms weeks of manual analysis into just a few hours or even minutes by serving as your AI research assistant.
- Fast, Accurate Transcription & Translation: Upload focus group audio or video, and BTInsights delivers a clean, speaker-labeled transcript in minutes (in many languages)—the AI even auto-cleans filler words. BTInsights also provides translation, so if you ran focus groups in different languages, you’re covered.
- Automated Thematic Analysis: BTInsights automatically identifies important themes and patterns across your transcripts using AI. You can even ask your data questions, and the platform generates an analysis with answers pulled directly from participant quotes. Crucially, all AI-generated insights can be traced back to the original source, so you can easily verify quotes. No need to worry about AI hallucinations with the BTInsights platform.
- Quote Finder & Highlight Reels: Need that perfect customer quote for a report or presentation? BTInsights includes a powerful AI search—type a keyword or concept and it surfaces the most relevant quotes across all your focus groups. From there, you can easily create video or audio clips of those moments and then generate highlight reels by merging those video or audio clips.
- Compare Groups and Segments: Label and segment your transcripts in BTInsights (by session, demographics, etc.) and then compare opinions across those segments. For example, you can instantly see how Group A vs. Group B felt about a topic or how different customer demographics responded. Spotting differences and trends that would be painful to do manually (reading through every transcript) becomes simple.
Why users love it:
BTInsights is essentially an user-friendly and all-in-one focus group analysis assistant—built-in transcriber, analyzer, and quote miner in one place. It’s a game-changer for any market or UX researcher drowning in qualitative data. We like it best because it provides a robust set of AI automations while still generating traceable, reliable results that free you up to spend more time interpreting insights rather than managing data.
The AI Copilot for qualitative analysis
Focus Groups – In-Depth Interviews
2. Dovetail – A Collaborative Customer Insights Hub
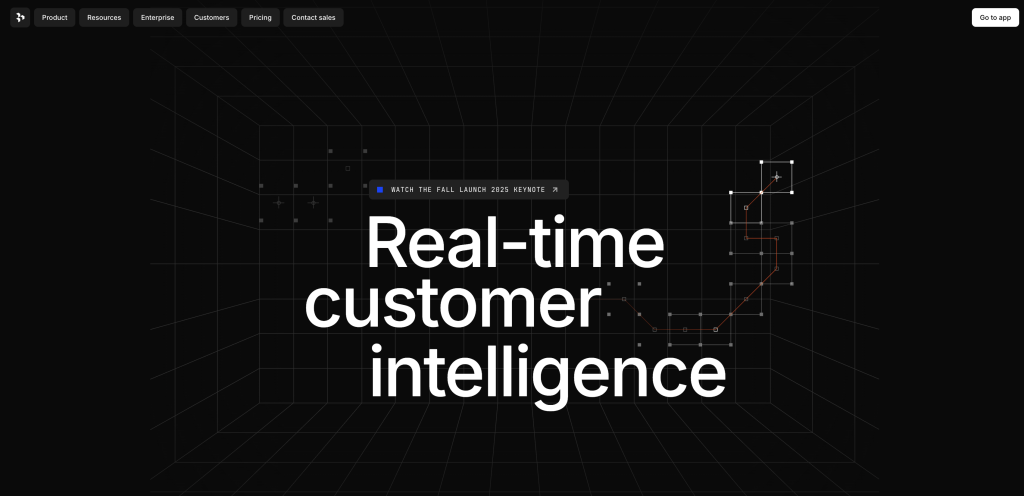
Dovetail is a research repository and qualitative analysis tool that UX teams and product researchers adore for organizing user interview and focus group data. At its core, Dovetail is a place where you can upload all of your notes, transcripts, and video clips from research activities, and then highlight and tag important moments to extract themes. It’s not an exclusively AI-first approach (you will be doing manual coding, too), but it has evolved into a slick tool that is excellent at streamlining and organizing the qualitative analysis process.
- Central Repository & Collaboration: Dovetail is best in team environments. You can upload your focus group recording or transcript and then highlight quotes and tag or label them. Then, many researchers can collaborate on Dovetail in real time – tagging, adding comments, and viewing each other’s annotations on their screen in real-time. This shared work environment lets your whole team be on the same page and helps to avoid missing any insights.
- Templates and Organization: The tool also offers templates to get you started (e.g. a focus group project template that has sections for each question that you ask during the group). Organizing your data (e.g. by question or theme) and having the option to tag each quote with a label in Dovetail helps you make your messy qualitative data so that important insights aren’t lost in the noise. Over time, you can then search all of your past research (focus groups, interviews, and other user research) to find, for instance, every quote about “onboarding” from any study – very handy for connecting the dots across research projects and making long-term research-based decisions.
- AI-Powered Features: Dovetail has historically focused on a purely manual coding (tagging) approach but in recent years, has added useful AI features that aid in the initial analysis process. The tool has an automatic transcription feature that can create text from your videos or audio recording into text and AI assistance to highlight important sections of your transcript for your review. Dovetail’s AI can do sentiment analysis on user feedback as well as produce summaries of high-level themes in your research to help you quickly surface insights from large and complex data sets.
- Reporting and Video Highlights: Dovetail does not automatically spit out action items like some other tools on this list, but it does help you create video highlight reels of users (useful for sharing/presentation snippets) by clipping together video snippets of participants. You can also assemble research findings into a shareable report format. In short, it’s a one-stop shop for taking you from raw data all the way to polished insights.
Why users love it:
It’s one of those tools that hits a good balance of power and usability. It’s conversational & collaborative – data and analysis is stored in a way that makes it easy for a non-researcher (PM, marketer) to drop in and make sense of it. Also popular for anyone who’s trying to figure out how to analyze user interviews in a systematic way, since it provides an obvious workflow: import data → highlight & tag → let AI help identify patterns → visualize & share results.
3. NVivo – The Classic QDA Software
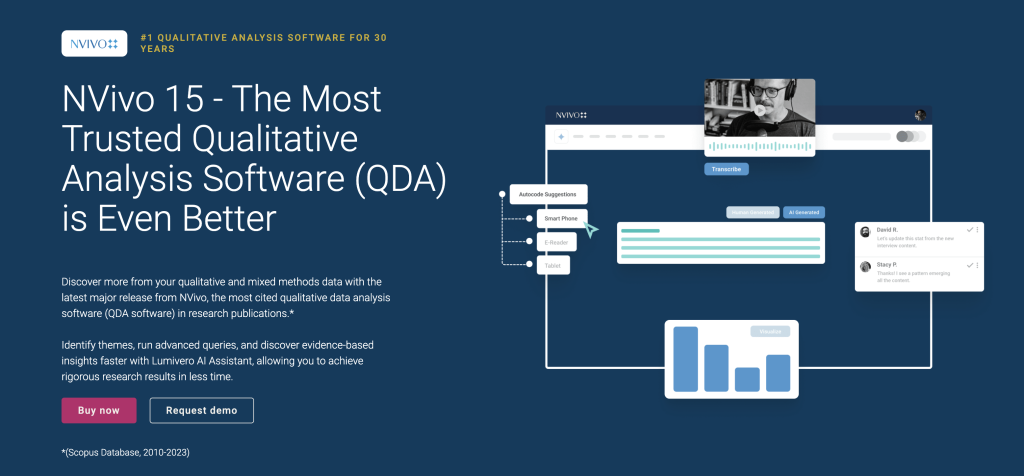
NVivo is a stalwart in the world of qualitative analysis – a professional-grade tool that most academics and professional researchers will likely be familiar with. It is a desktop-based QDA (Qualitative Data Analysis) software with robust capabilities for coding and querying qualitative data. NVivo is not inherently an AI-powered tool (and it doesn’t claim to be), but has started including AI-assist functionality in recent versions.
- Robust Coding & Querying: NVivo 15 lets you import large amounts of unstructured text – focus group transcripts, interview notes, open-ended survey answers, and even images/PDFs – and apply a fine-grained coding schema. You can build hierarchical code structures (parent themes with subcodes) and tag text or multimedia segments to those themes. The tool then lets you run complex queries, such as “show me all excerpts where cost and satisfaction were both discussed,” enabling highly rigorous analysis.
- Multi-Format Support: One of NVivo’s big draws is its ability to handle different types of data within one project. Text, audio, video, and even images are all supported. In the context of a focus group, this could include importing the video, linking it to the transcript, and coding directly on the video timeline. If a participant had drawn a diagram on the whiteboard at one point during the session, you could even import that image and annotate it! It was built for deep, mixed-media qualitative data.
- AI Assistance: NVivo has a newly added AI-powered analysis assistant (one of Lumivero’s integrations) that can help with summarizing themes or auto-coding transcripts to some extent. For instance, it could suggest groups of sentiment or automatically provide a word frequency cloud. This doesn’t obviate the need for manual coding, but will accelerate the grunt work involved – and give you a starting point to build on and refine.
Why users love it:
It’s very powerful and comprehensive. NVivo is best for researchers who want full control over their analysis and need advanced features like mixed-methods integration (it can import survey data and let you connect qual and quant) or team collaboration with versioning. NVivo has a multi-user mode for teams and can merge projects from different coders to calculate inter-coder reliability, etc.
There is a bit of a learning curve. Market researchers with backgrounds in lighter-weight tools are likely to find NVivo a bit clunky at first.
4. ATLAS.ti – Rigorous Qual Meets Visual Insight
ATLAS.ti combines powerful AI functionality with human expertise for coding and visual analysis. It’s an established QDA software solution similar to NVivo in many ways, though while NVivo gets points for intuitive UI, ATLAS.ti users consistently report more-powerful, sophisticated visualization capabilities. Atlas is the kind of tool where the name says it all: rigorous qualitative analysis functions meet the features that let you literally see the connections in your data (via networks, concept maps, etc.). And yes, ATLAS.ti has also jumped on the AI bandwagon, with things like auto-coding using pattern recognition to streamline your process.
- Many Coding Options: As you analyze focus group transcripts in ATLAS.ti, you can use all the standard coding methods – open coding, axial coding, in-vivo coding (building codes from participants’ exact wording), and so on. The software allows you to label chunks of text, audio, or video with codes and construct a code system as detailed as you like. It also has features like the ability to attach memos to segments (memos can include analytic notes you jot down as you code, for example)
- AI Pattern Detection (Auto-Coding): ATLAS.ti also introduced auto-coding using AI, which can search your data for patterns and automatically apply code labels. For example, you might train it to automatically detect positive/negative sentiment or key topics/themes across all focus group participant comments. You’ll want to audit and edit these auto-codes, of course, but it gives you a quick first pass at chunking up the data. So you get some of the thoroughness of ATLAS.ti along with some of the speed of the newer AI tools.
- Visualization & Networks: A standout feature of ATLAS.ti is the ability to build Networks. As you code and develop themes, you can create network diagrams that visually represent how codes are connected to each other and to quotes or documents. You could say it’s mind-mapping your qualitative research. This is great if you are a visual thinker or need to present the organization of your themes in a report. It also produces other charts: code frequencies, co-occurrence tables (which codes often appear with each other), and other visuals that help you go beyond the surface of the analysis.
- Teamwork and Academic Detail: ATLAS.ti can be used by a team, though (unlike Dovetail) it’s not live-sync collaboration – you can combine project files from different analysts, etc. It also nudges you toward good research practice, with features like memoing, audit trails, and extensive output reports that help ensure your focus group data analysis is reproducible, transparent, and ultimately credible.
Why users love it:
It’s a feature-rich application and has just become a lot smarter with the addition of AI. ATLAS.ti users that have used it for many years love the sense of freedom and flexibility it gives you to organise and link data however you like. You don’t have to do it one way – you can use it for grounded theory, thematic analysis, mixed methods, etc. and it has all the underlying functionality to support your choice of methodology. Market researchers will particularly like the way ATLAS.ti handles large-scale qualitative projects or where you have multiple waves of focus groups as it scales really well.
5. MAXQDA – Versatile QDA Software with Mixed-Methods
MAXQDA is a very popular and capable qualitative + mixed-methods data analysis tool (big-time use in academia and market research) known for being feature-rich but more user-friendly and great for blended qualitative + quantitative projects. MAXQDA can ingest almost any data type (texts, surveys, videos) and, like NVivo and ATLAS.ti, now has an AI Assist suite in the latest version, which aims to assist with transcription, summarizing coded segments, auto-coding, etc.
- All-in-One Analysis Tool: MAXQDA is an all-in-one tool with robust coding and categorization options. Very similar to NVivo and ATLAS.ti: you can import the transcripts from your focus group, then start to code, annotate text segments, add memos, and write code memos. It has a clean and straightforward interface with four main windows (your data, your codes, retrieved segments, etc. ), which makes it easy to see everything at once and track the project as you code and review the results. It’s built to handle big, large-scale qualitative projects, but can do quantitative content analysis and stats charts as well (MAXQDA has been in the game long enough to be used in legit mixed-methods studies).
- Mixed-Methods Support: MAXQDA’s defining difference from most qualitative software: it’s made to easily integrate, code, and analyze mixed data. Say your focus group study is combined with a quantitative survey – MAXQDA is very good at putting both types of data together to analyze both qualitative transcripts and quantitative data side by side. You could tag comments or themes from focus groups, then use MAXQDA’s built-in stats options to create frequency tables or charts.
- AI Assistance Features: MAXQDA’s AI Assist, added in recent updates, covers many of the same automation and assistance features we saw in NVivo and ATLAS.ti (AI transcription of audio/video, automatic coding, summaries of coded text segments, etc.). Beyond that, they offer AI-generated summaries of coded segments (say you have 50 quotes under “Customer Satisfaction” code – MAXQDA can try to generate an auto-summary of those segments for you), and “AI Suggests” for automatically recommending sub-codes. MAXQDA now also lets you have a AI chat with your data in a limited way (basically a lightweight chatbot integrated into MAXQDA where you ask questions about your texts, the AI has to look in your imported texts and search for answers, then it can “chat” with you about this limited data set.
Why users love it:
It’s widely considered as being quite flexible and easy-to-use. New users comment that MAXQDA has a slightly more user-friendly interface and easier learning curve when compared with some of the other programs. MAXQDA works well for team projects as several users can work on the same project (either through merging projects or using the cloud-based version of the software called MAXQDA TeamCloud). Many researchers also love the output features – there are easy options for producing structured reports, outputting codebooks, and connecting with statistical packages (e.g. SPSS), for example you can export your coded data as variables for quantitative analysis.
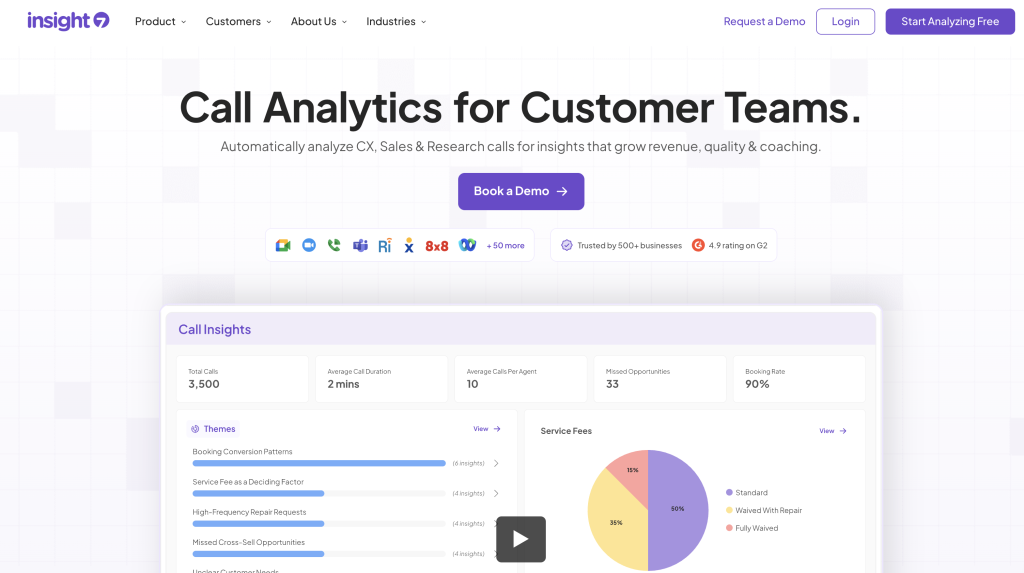
6. Insight7 – AI Insights for Calls and Focus Groups
Insight7 is a relatively new tool which was built specifically for AI analysis of focus groups discussions, user interviews, and call transcripts. Marketed as a no-code, end-to-end insights platform – drop your qualitative data in and its AI does the rest (automatic transcription, coding, and theme detection, and even report generation). It’s an attractive proposition for teams looking to quickly surface actionable findings from high volumes of customer conversation, and does so efficiently.
- Automatic Coding and Theme Detection : Insight7 is built from the ground up to simplify the entire focus group analysis workflow. The AI engine automatically detects important themes, sentiments, and trends across your transcripts – performing the task of “first pass” coding for you. If you had uploaded hours of recorded group chat, Insight7 would quickly be able to point out that.
- Interactive Dashboards & Visualizations : After the AI has worked its magic, Insight7 brings the findings to life in interactive dashboards. There are visualizations of general trends (eg. what themes came up most frequently), sentiment breakdowns (what % of comments were positive/negative on a particular topic), and other helpful charts. Interactive by design, it’s built to be exploratory (eg. filter by customer segment, or timeframe). Visuals are helpful too, making it easy to make sense of otherwise dense text data.
- Multi-Format Data Support : Insight7 does not limit you to text transcripts. You can upload audio files, video recordings, or text, and its AI will analyze them jointly. So in the case of a focus group, you could upload the video recording – Insight7 will transcribe it, then analyze the text, but also let you “jump to the video” when context is needed. It’s a nice way to combine the precision of text analytics with the rich context of video recordings. Multi-data support means you can also surface consolidated insights across interviews, support call logs, survey open-ends, and more.
- Quotes, Highlights and Reports : Similarly to BTInsights, Insight7 allows for easy extraction of quote snippets and compilation of highlights.
Why users love it:
Insight7 is an AI co-pilot for qualitative research in a nutshell. The tool is a powerful ally for market research teams that are working with high volume of focus groups or customer calls, and need to move fast on analysis. By automating many of the “heavy lifting” parts of the process, it frees up researcher capacity for higher-value activities. And by virtue of features like journey mapping and recommendation generation, Insight7 is not just about analysis – it aims to help in translating insights into action.
Conclusion
Focus groups remain a mainstay of the market researcher’s toolbox. To get the most value from focus group discussions, an effective analysis process is key. But in 2025 and beyond, the question is no longer “how do you analyze focus group data?” but rather, “what’s the best tool to analyze focus group data?”
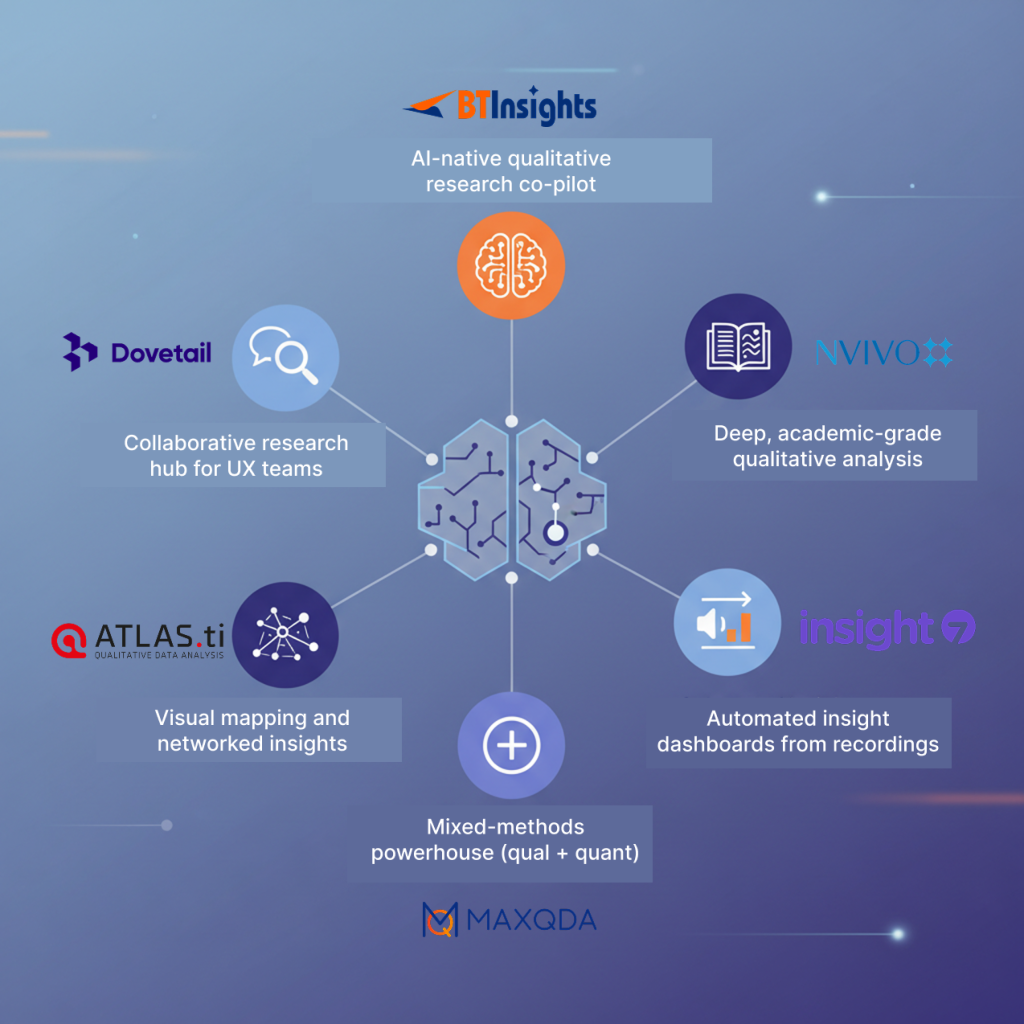
In our round-up of the six best focus group analysis tools, we’ve seen there’s no silver bullet: each platform excels at different tasks.
If you want an AI-native qualitative research co-pilot that auto-transcribes, finds verified quotes, and summarizes themes → Choose BTInsights.
If collaboration and research repository features matter most (team tagging, sharing, searchable insights) → Choose Dovetail.
If you need deep, academic-level rigor with complex coding and querying options → Choose NVivo.
If you love visual analysis (maps, relationships, code networks) and want strong AI assists → Choose ATLAS.ti.
If you work with both qualitative and quantitative data and want an easy, mixed-methods workflow → Choose MAXQDA.
If you analyze lots of calls or focus group videos and want fast, fully automated insights dashboards → Choose Insight7.
The AI Copilot for qualitative analysis
Focus Groups – In-Depth Interviews